Good Day Traders,
Overview & Highlights: Lots of companies reporting over the next 3 weeks. Check any stocks you may be holding to insure you have at least a 10% profit cushion before holding over earnings. Secondly this Wednesday night’s training will provide a very valuable review of how best to trading the enhancements to the Active Trend Trading System. With only 9 weeks left in the year the timing of this training is perfect to move successfully through the rest of 2015.
Webinars: At Active Trend Trading we offer two webinars per week to provide training plus trade and market updates. See the schedule below for the next webinars.
How to Make Money Trading Stocks on Nov 6, 2015.
Register Here: https://attendee.gotowebinar.com/register/4465485427072266241
Next Training Webinar: Nov 4, 2015
For Premium Members our Wednesday evening training is developing some fantastic traders!
Mid-Week Market Sanity Check Topic: Trading the ATTS with Enhancements
_____________________________________________________
Managing Existing Trades:
Strategy I: Currently 3 open trades.
Trade 1: Bought 150 Shares of JUNO at 48.71 for a pre-earnings run. T1 = 52.36 (Hit) with a S.L = 46.75.
Hit the T1 Profit Target today and closed 100 shares. The remaining shares will be sold by earnings on 11/10 or at 15% which is $56. The Stop Loss on the remaining 50 shares has been moved to Break Even (purchase price). Net profit thus far = $365
Trade 2: Bought 200 Shares of FIT at 37.80 for a pre-earnings run. T1 = 40.63 with a S.L. = 36.28.
Hit T1 = 40.63 and sold 100 shares at 40.62 for a gain of 7.5%. Close remaining shares at 15% with a stop loss at B.E. or prior to close on 11/2/15. Net total profit thus far = $282
Trade 3: Bought 150 Shares of EPAM at 78.61 for a pre-earnings run. T1 = 84.50 with a S.L. = 75.45 Close Position prior to close on 11/5.
Strategy II: No Open Trades
Wealth & Income Generation Strategy III Trades:
Trade 1: Long IWM Jan16 127C & 127P – 7 contracts of Weekly IWM Nov1 114P sold at 0.66. Will close at 0.10 or a Stop Loss of 1.30.
Trade 2: Long TSLA Jan17 250C & Long Jan17 220P – With increasing volatility with earnings will open two positions prior to 11/3 close.
Several members have asked about this strategy and a more detailed explanation is available at: https://activetrendtrading.com/wealth-and-income-strategy/ .
I posted a video about how to choose the weekly options to short for this strategy. It can be viewed at: https://activetrendtrading.com/videos/
Additionally some of these trade may be selling weekly puts on up trending stocks. If you are interested in parallel trading this strategy register at this link: http://forms.aweber.com/form/99/1278533099.htm
Pre-Earnings Trade: Earnings on NOAH is 11/10 AMC so if a trade sets up, exiting prior to this date would be the objective with a 5%-15% gain. Waiting for the trigger. Other candidates include: JUNO & YY.
_________________________________________________
Potential Set Ups for this week: If the indexes are ready to weaken then I’ll turn my attention to the Downside candidates and also watch to see how the Toss-Ups and Upside candidates pullback. We’re moving into a time of the year when the indexes tend to have an upside bias, but this has been an interesting year so we’ll see if this personality comes through this year.
Upside: HAWK and QIHU
Downside: UVE, CALM, GPRO and ALK
Toss Ups: PLAY, AVGO, HAWK, LNKD and NFLX**. (NFLX may be trying to right itself worth watching for potential long side set up.
Leveraged Index ETFs: Waiting for New or Second Chance signal. Highlight video of results YTD will be posted this week.
The Early Warning Alert Service has hit all three major market trading point this year. See this brief update video for more details: https://youtu.be/PRLmPQLHjiI
If simplifying your life by trading along with us using the index ETF is of interest you can get the full background video at: https://activetrendtrading.com/etf-early-warning-alerts-video/
General Market Observation: With 9 weeks left in the 2015 is up the path of least resistance? There are many cross-currents working globally from stimulus action in Europe and China and a Fed that wants desperately to save face and raise rates before the end of the year! Right now we don’t know how this tug-o-war will play out but is should be interesting and make for an exciting end of the year. We have 3 weeks before entering holiday trading and potentially a Santa Claus rally. The pecking order of the Tracking Indexes is NDX strongest, SPX next and RUT still playing the role of “tail end Charlie”. The monthly charts of all three indexes was positive. Will this translates to new highs on the NDX and SPX? Will it translate to the Russell getting in gear through the end of the year? Will the Fed raise rates in December and does it matter? It could be that a sideways trading range may actually be the path of least resistance.
It remains a market of stocks and finding the stocks hitting on all cylinders is key to trading the remainder of the year successfully.
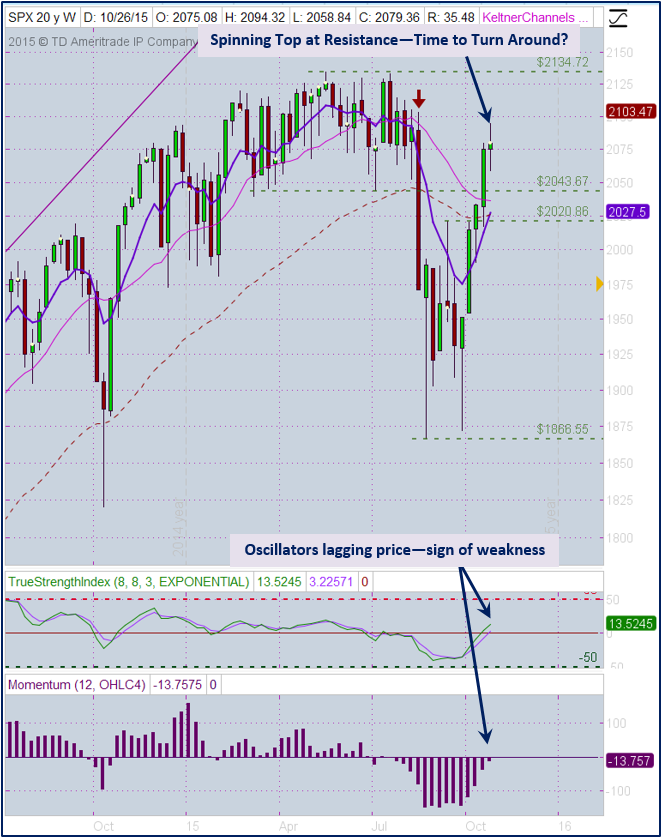
SPX: Friday was the last day of the month and the monthly chart of the S&P shows a positive monthly move supported by 5 weeks of moving up. Last week the index sputtered a little and finished the week with a Spinning Top weekly candlestick which is telling us that price is ready for a rest or has hit a level of resistance that will blunt the press to move higher. If support at 2058 is taken out then we may be seeing a classic lower high on a weekly chart. This could set the stage for a drop back through the daily and weekly moving averages that are currently favoring the uptrend. To trade the SPX ETF’s to the long side a pullback to the around the 8 day EMA would provide a potential long entry, but remember this would be the third pullback to this level over the past 5 weeks so it could be providing clues of weakness and not strength. Additionally both momentum oscillators are lagging price action on the weekly chart—not a sign of strength.
Preferred: SPY, UPRO and SPXL
NDX: The NASDAQ 100 finished Friday with a Bearish Engulfing pattern on the daily chart. Price action came close to the yearly high at the 4694.13 level but may be either pulling back or pausing. The weekly chart show a long upper wick for the week telling us that sellers did come in to push back from the resistance high level. A support zone starts at 4599 which is also the level of the 8 day EMA. The gap up window provides support from 4599 down to 4505. I will trade the NDX much like the S&P ETF’s honoring the uptrend but recognizing that we could be witnessing a more traditional lower high or double top in the case of the NDX.
Preferred ETF’s: QQQ and TQQQ
RUT: The weakest of the Tracking Indexes. As discussed previously this is a positive and a negative. If additional momentum strength comes into this index and it breaks up with gusto then it could be in for a bigger run to catch up with the other two indexes. On the flipside of that scenario is any negative weakening could drive price quickly back to the last swing low at 1080. The challenge be ready for either direction.
Preferred ETF’s: IWM and TNA
_____________________________________________
The Early Warning Alert Service has hit all seven major market trading point this year. A new update video will be posted on this service the week of November 1st.
If simplifying your life by trading along with us using the index ETF is of interest you can get the full background video at: https://activetrendtrading.com/etf-early-warning-alerts-video/
The How to Make Money Trading Stock Show—Free Webinar every Friday at 10 a.m. PDT. This weekly live and recorded webinar helped traders find great stocks and ETF’s to trade with excellent timing and helped them stay out of the market during times of weakness.
The “How to Make Money Trading Stocks” Show Nov 6th
Register Here: https://attendee.gotowebinar.com/register/4465485427072266241
To get notifications of the newly recorded and posted How to Make Money Trading Stocks every week subscribe at the Market Tech Talk Channel: https://www.youtube.com/channel/UCLK-GdCSCGTo5IN2hvuDP0w
- The Active Trend Trader Referral Affiliate Program is ready. For more information or to become an Affiliate please register here: https://activetrendtrading.com/affiliates-sign-up-and-login/
___________________________________________
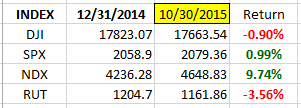
Index Returns YTD 2015
ATTS Returns for 2015 through Sept Oct 30, 2015
24.0% Invested
Margin Account = +8.5% (Includes profit in open positions)
Early Warning Alerts = 10.2%
Active Trend Trading’s Yearly Objectives:
- Yearly Return of 40%
- 60% Winning Trades
- Early Warning Alert Target Yearly Return = 15% or better
For a complete view of specific trades closed visit the website at: https://activetrendtrading.com/current-positions/
Updated first full week of each month.
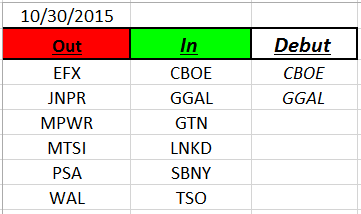
Outs & Ins: CBOE and GGAL make their debut on the IBD 50 list this weekend. CBOE reported earnings on 10/30 and dropped to the 20 day EMA on heavy volume. On a weekly chart it appears more like a double top pattern showing a Shooting Star reversal candle. GGAL made a strong pre-earnings run and reports earnings on 11/4 during market hours. There are better candidates within the IB 50 list that these two add-ons at this time.
LNKD is back on the list after a hiatus of several months. Price gapped above resistance at 233.18 and I’ll be watching to see if price pulls back to this level or waits for the 8 day EMA to catch up before planning any potential action. Overall 40% of the IBD reports earnings within the next 3 weeks. 14 of these companies report this week.
Share Your Success: Many of you have sent me notes regarding the success you are having with the Active Trend Trading System. Please send your stories to me at dww@activetrendtrading.com or leave a post on the website. Thanks.