Good Day Traders,
Overview & Highlights: It’s good to be home in Hawaii again! The first part of any move is always a challenge waiting for the furniture to arrive and getting set up in the house. Right now we’re sleeping on a blowup bed (BLUB) and working off a folding table. It great moving back into our old house that was rented for the 12 years we were in California. I’ve just about adjusted to the time difference and got up Friday prior to the 3:30 a.m. market open. I will hit the open between 2-3 times a week leaning towards Wednesday through Friday when more of the market action takes place. I will be doing my homework and getting out the trade alerts and updates earlier in the day after the market closes so they will get to members so they can also plan their trades for the following day.
I was fortunate to attend a training conference webinar on Saturday on Trend Trading and tools other traders are using. I’m very excited about one tool I’ll be training on this Wednesday evening. The tool is called Trend Candles and I believe introducing these will help members be more patient and have a better understanding about direction to trade visually. I’ve provided an example in the Market Review section. So instead of Trading Psychology I’ll be demonstrating how to use this tool, plus talking about understanding the ebbs and flows of the markets and stocks over the next few weeks! I believe this training will provide all members stepping stones to aid in moving to a higher level of trading success.
Webinars: At Active Trend Trading we offer two webinars per week to provide training plus trade and market updates. See the schedule below for the next webinars.
How to Make Money Trading Stocks on Friday, June 17th
Register Here: https://attendee.gotowebinar.com/register/6740381586676275713
11:30 a.m. PDT
Next Training Webinar: June 15th
For Premium Members our Wednesday evening training is developing some fantastic traders!
Mid-Week Market Sanity Check Topic: Ebbs & Flows—Riding the Trends!
Managing Existing Trades: Positions open for 2 strategies.
Strategy I Portfolio Building:
Position 1: Bought 240 shares of SIX on 6/7 as outlined by the text and email alert. Opened price at 57.45—Position up about 1.8% and running into resistance. While the technical are positive don’t want to give back up a full 4% stop loss. Setting new stop loss at $1.00 below 57.04
T1 = 5% -10% to close 120 Shares
T2 = Return to past resistance at $62
Stop Loss = 56.04
Position 2: Long 100 shares of TZA
Bought 200 shares of TZA at 41.60
T1 = 5% -10% to close 100 Shares
T2 = Attempt to hold remaining shares up to earnings and then close
Stop Loss = Will hold and sell weekly covered calls on remaining position to reduce cost basis while waiting for the Market downturn. Will hold until July 1st.
Hit T1 sold 100 shares at 43.79 for a gain of 5.26% or Profit of $219.00
Strategy II Income Generation:
TZA Trade: Sold 1 contracts of TZA 10Jun 37.5C at 0.44—Potential Profit $44
Thus far $66 has been cleared to reduce cost basis of the TZA position. Bought back 6/8 at 0.04 for a $40 profit—Total Premium Collected so far = $106
I will monitor volatility for a potential trade when VIX turns around. Right now there is very little fear in the market place!
Strategy II stocks of interest for this week: TSLA & Index ETF’s. Will reload with new candidates after this weekend’s review.
For members wanting to better understand this Strategy there is a very good training video at: https://activetrendtrading.com/basic-option-strategy/
Strategy III Wealth & Income Generation Trades: Two Foundational Positions are in place to sell weekly options against. The recalculated weekly revenue needed from these foundational positions was forward in an update report earning last week. My objective with this Strategy is to collect enough weekly premium during the life of the LEAPS Strangle on both SPY and TSLA to both pay for the capital invested and gain between 50% – 100%.
Tip for Experienced Option Traders: Occasionally after a weekly trade goes against me but the trend appears to be changing I will add one naked contract over and above my foundation position and close this out after it gains at least half of the premium I’ve collected. Doing naked options is not for everyone and I keep my risk small by only doing one contract above my covered limit. In other words, if I can sell 4 contract covered by my long leaps I’ll sell one additional. This helps hedge the losses a bit but it this tactic is not without risk and must maintain a tighter stop than I would normally use with the regular position.
Note: We do our best to get both text alerts and email alerts out in a timely manner, occasionally there will be trades that are missed because of delay in the Text or Email alert applications. Additionally, please double check with your broker to assure they allow spread trades like we do with Strategy III. Some do and some don’t.
Additionally, it is crucial when selling premium against the Long LEAPS position that the premium collected cover the weekly cost of holding the LEAPS plus an additional amount to over this amount as a gain. This is one of the reason I sell premium of weekly options that are close to be At The Money. I base my selling on the expected move during the next week. If one is not bringing enough weekly premium this trade will not work out as well and may wind up being a losing trade.
Strategy III Weekly Results Week ending 6/10:
SPY: Profit +$140
TSLA: Loss -$500
Trade 1: Foundation Position is 4 contracts of SPY Jan17 205C and 4 contracts of SPY Jan17 200P Current Trade—Currently Up 16.67%; Premium Collected since opening trade on 1/4/16 = $4,394
Waiting for new weekly set up
Trade 2: Long TSLA Jan17 250C & Long Jan17 220 + New Positions Jan17 210C and 220P: Current Position Total Invested $17,480
Currently Up 54%: Premium Collected since opening trade on 9/28/15 = $11,857 + New Positions at $859 = Total Collected $12,716
Sold 1 contracts of TSLA 17Jun 217.5P at 3.45—Potential Profit $345
Sold 1 contracts of TSLA 17Jun 215P at 2.54—Potential Profit $254
Sold 1 contracts of TSLA 17Jun 222.5C at 3.25—Potential Profit $325
Sold 1 contracts of TSLA 17Jun 225C at 2.32—Potential Profit $232
Update: Purchased the TSLA 20Jan 17 210C/220P Strangle at $5890 to increase exposure to Strategy III moving forward. Having multiple positions to sell premium against provides some additional opportunities for growth. I will again protect the downside with a stop loss of $4.90 over the amount of premium collected. The average amount I’ll need to generate on this portion of the trade is $350 per week.
Several members have asked about this strategy and a more detailed explanation is available at: https://activetrendtrading.com/wealth-and-income-strategy/
I posted a video about how to choose the weekly options to short for this strategy. It can be viewed at: https://activetrendtrading.com/videos/
Additionally some of these trade may be selling weekly puts on up trending stocks. If you are interested in parallel trading this strategy register at this link: http://forms.aweber.com/form/99/1278533099.htm
Pre-Earnings Trade: No weekly candidates.
Pre-earnings trades can be a great supplement to the portfolio building portion of Strategy I. Depending on the stock and technical analysis they tend to be predictable and repeatable. For busy traders focusing on pre-earning opportunities can free one up from the necessity of constantly chasing stocks during other periods of the year. The process repeats four times a year and capturing a 5%-15% return four times a year can compound very nicely!
Potential Set Ups for this week: Lot of upcoming events through the rest of June that could move the markets in either direction. With the Indexes weakening I’ll focus on downside candidates unless the news from the Fed drives the market back into an uptrend.
One observation over the past few weeks is that many stocks are showing ‘V’ bottoms. This type of bottom tends to be weak and can provide some violent correction once the momentum starts running out. Because of this we need to adjust expectations for returns on individual trades to smaller profit targets and tight stops. 5% – 15% are great objectives for initial targets and if hit setting breakeven stop losses is prudent.
Upside: Inverse Index ETFs, SPXU, SQQQ or TZA.
Downside: Some very strong weak candidates for this week if the Indexes continue to weaken. These include: NFLX, SBUX, TSLA (prime candidate), MA, NTES and BIDU
On the Radar: Stocks & ETFs that could go either way include: UPRO, SPXU, TQQQ, SQQQ, TNA, TZA, TSLA (270 resistance/140 support), NFLX, BIDU, MA, V (Visa may provide some upside opportunities because several companies like Costco are transitioning from American Express to Visa), LNKD, BABA, BIDU, OLLI, AMZN, and FB.
Stocks identified by ** that are close to a potential entry point.
Early Warning Alerts for Leveraged Index ETFs: Waiting for New Entry trigger and Alert reset.
A downside trade for TZA triggered on 5/17 and a courtesy alert was sent to all EWA members. I plan on holding this position until July 1st or until price hits $55. During this time rather than a stop loss I will sell weekly covered calls. A major reason of choosing TZA is that it has weekly options which provides the opportunity to collect premium while price oscillate. Going forward Mike will trigger the long EWA alerts and I will trigger the short side triggers as courtesy alerts to members.
The Early Warning Alert Service hit all eight major market trading points in 2015. See this brief update video for more details: Early Warning Alerts Update Video or at https://youtu.be/GJwXCL4Sjl4
If simplifying your life by trading along with us using the index ETF is of interest you can get the full background video at: https://activetrendtrading.com/etf-early-warning-alerts-video/
General Market Observation: Friday ended last week with a gasp and it appears there are too many variables heading into the final weeks of June! First of course is the Fed meeting this week. While it appears that the Fed will again be accommodating by not raising rates, there has to be concern about poor job reports and other economic news showing that the current faux recovery may come under additional strain. Add to this the upcoming vote on Britain staying in the EU and the uncertainty grows. Are we witnessing the last gasp prior to a downside capitulation? We shall see! On the other side of this debate are some who are calling for a big rally into the end of the year. What would be the catalyst for that? The US going negative on interest rates or spinning up some hybrid of Quantitative Easing? If this happens it may result in a rally, but into what—a steeper ledge when the house of cards finally falls? As traders do we care? In fact, we should not be concerned and focus purely on the setups that stocks and market provide and trade accordingly.
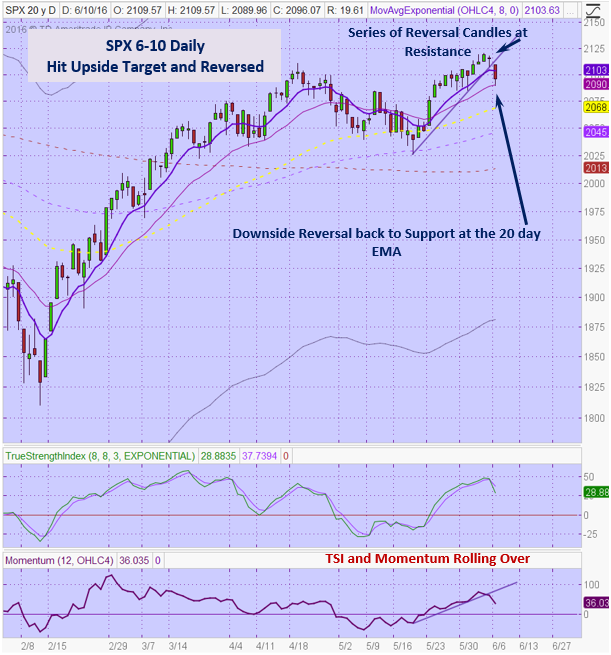
The beginning of this week may be soft as everyone waits for the Fed. Clearly sellers showed up on both Thursday and Friday taking profits from the latest run up. On the SPX Friday’s sell off only took prices back down to the 20 day EMA. This level is slightly above a stronger level of support at 2085. Both TSI and Momentum have rolled over so is this a hint of things to come as we move deeper into the dull summer months? The weekly chart finished last week with an ominous Shooting Star Bearish reversal candle after price action poked it’s nose into the strong resistance zone which is topped by last year’s high. Negative divergence has commenced on the weekly chart and we will see if price action turns negative shortly. At this point I’ll wait until after the Fed meeting to make any large commitments.
The other two members of the Tracking Index team showed similar action to the SPX last week with the NDX showing greater weakness. Friday’s gap down and close below the 20 day EMA by the NDX was enough to roll the shorter term moving averages over. There is support at the 4400 level that may provide a bounce or resting point over the next few days. If this level fails watch for the next stop to be at 4300. Because NDX failed to make a new high on the resent thrust it may be more susceptible to a harder fall. The RUT was not immune to Friday’s selloff, but it held up better than the other Tracking Indexes. Price action found support at 1160 but the fall lasted most of the day. A Tombstone Doji reversal signal on the weekly chart may be indicating that the latest up thrust has ended. I am long TZA the 3x leveraged inverse ETF on the Russell and have been selling covered calls against it over the past few weeks. My time stop on this position is July 1st unless price dramatically fails over the next few weeks!
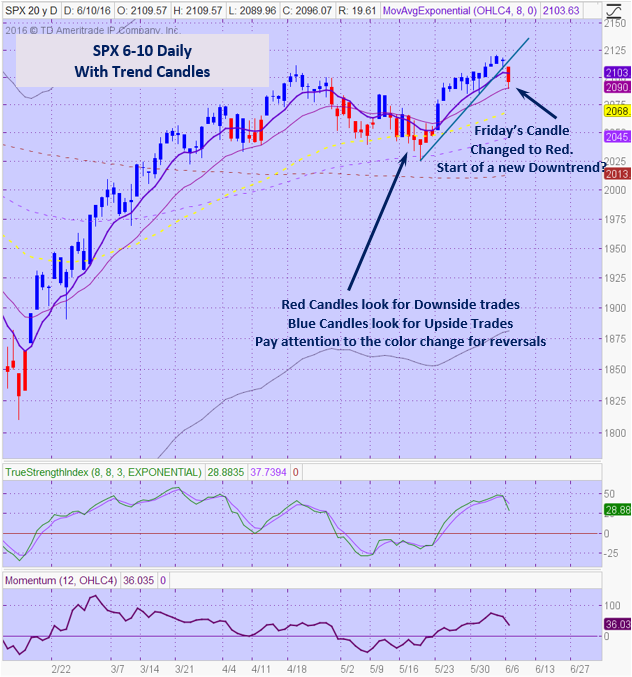
In the introduction I mentioned a new charting tool I was introduced to on Saturday. It is included on the chart below my regular daily SPX chart. On the second chart note how the candles change color from blue (for uptrend) and red (for downtrend). I will be going into depth on these new candles on Wednesday evening. A hint on what they will help us do is plan potential long trades, short trades and improvement timing exits. If the color of the candle is blue, we wait for pullbacks to enter trades and the opposite when the candles are red. The candles work on all time frames and provide instantaneous feedback on direction to trade. As the second chart show Friday’s candle turned to Red on the SPX. The other Active Trend Trading Rules still apply but these candles should provide additional clarity when planning trades! Secondly, I’ve converted the Momentum oscillator to a line chart rather than the histogram. The line chart clarifies direction and pattern a better than the histogram.
SPX: Downside Market Short the SPY, SPY Puts or SPXU.
Preferred Long ETF’s: SPY, UPRO and SPXL
NDX: Downside Market Short the QQQ, QQQ Puts or SQQQ.
Preferred Long ETF’s: QQQ and TQQQ
RUT: Downside Market Short the IWM, IWM Puts or TZA.
Preferred Long ETF’s: IWM and TNA
The How to Make Money Trading Stock Show—Free Webinar every Friday at 11:30 a.m. PDT. I’m looking for the best time to offer this webinar. I want to try closer to the close on Friday to see how that works out for potential trades going into the close. This weekly live and recorded webinar helped traders find great stocks and ETF’s to trade with excellent timing and helped them stay out of the market during times of weakness.
How to Make Money Trading Stocks on Friday, June 17th
Register Here: https://attendee.gotowebinar.com/register/6740381586676275713
11:30 a.m. PDT
To get notifications of the newly recorded and posted How to Make Money Trading Stocks every week subscribe at the Market Tech Talk Channel: https://www.youtube.com/channel/UCLK-GdCSCGTo5IN2hvuDP0w
– The Active Trend Trader Referral Affiliate Program is ready. For more information or to become an Affiliate please register here: https://activetrendtrading.com/affiliates-sign-up-and-login/
Index Returns YTD 2016
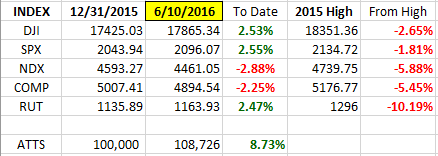
ATTS Returns for 2016 through June 10, 2016
Percent invested initial $100K account: Strategies I & II invested at 25%; Strategy III invested at 25.9%.
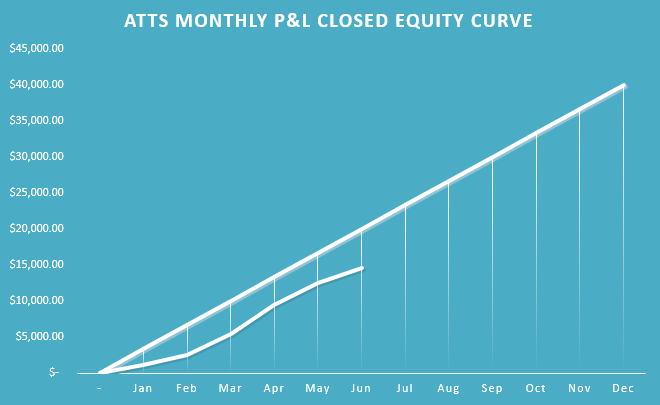
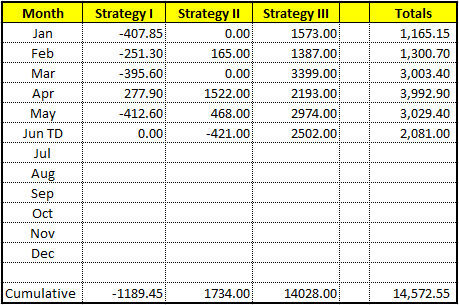
Current Strategy Performance YTD (Closed Trades)
Strategy I: Down -1189.45 or -1.69%
Strategy II: Up $1734 or 17.34%
Strategy III: Up $14028 or +54.10%
Cumulative YTD: 14.57%
Active Trend Trading’s Yearly Objectives:
– Yearly Return of 40%
– 60% Winning Trades
– Early Warning Alert Target Yearly Return = 15% or better
For a complete view of specific trades closed visit the website at: https://activetrendtrading.com/current-positions/
Updated first full week of each month. (Next week for June)
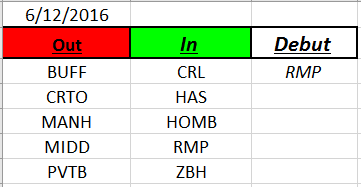
Outs & Ins: RMP makes its debut on the IBD 50 this weekend. The IBD 50 Indexes took a bigger hit than the Tracking Index on Friday so this list may provide excellent downside candidates if the market falls apart.
A review of the list shows many members of the list are extended and primed to pullback with the Indexes. Downside candidates include USCR, EW, EDU, PRAH & NTES.
Share Your Success: Many of you have sent me notes regarding the success you are having with the Active Trend Trading System. Please send your stories to me at dww@activetrendtrading.com or leave a post on the website. Thanks.