Good Day Traders,
Overview & Highlights: Big question for the next couple of weeks, will the Indexes followed the historical post-election pattern? We shall see. I will be traveling to California at the end of this week for the Bay Area Money Maker meeting on Saturday. If you are in the Bay Area stop in at the San Jose Masonic Saturday morning starting at 9 a.m.
Upcoming Webinars: At Active Trend Trading we offer two webinars per week to provide training plus trade and market updates. See the schedule below for the next webinars.
The How to Make Money Trading Stock Show—Free Webinar every Friday at 11:00 a.m. PDT. This weekly live webinar helped traders find great stocks and ETF’s to trade with excellent timing and helped them stay out of the market during times of weakness. With guest from around the world you get a great Global perspective.
I will be flying to California this week so the next webinar will be the second Friday in February.
How to Make Money Trading Stocks on Friday, Feb 10th
Register now for the next live webinar at the link below:
Register Here: https://attendee.gotowebinar.com/register/7562489734728631809
Time 11:00 a.m. PDT
Next Training Webinar: Feb 1st
For Premium Members, our Wednesday evening training is developing some fantastic traders
Topic: Tying it All Together
** Friday’s “Final Hour”: Feb 10th **
Time 12:00 p.m. PDT
For Premium Members, provides trades and set ups during the final hour of weekly trading.
Managing Current Trades:
Strategy I Portfolio Building: Long IDCC at 92.30 on 1/25
Stop at 5% or close below 8 day EMA
Profit Target T1 = 7%
Profit Target T2 = 15%-20%
Strategy II Basic Options: No Open Positions
For members wanting to better understand this Strategy there is a very good training video at: https://activetrendtrading.com/basic-option-strategy/
Strategy III Wealth & Income: Foundation positions are open in SPY, TSLA and NUGT. Total capital for Strategy III = 30% or $26.6K.
SPY: Waiting for setup at the upper or lower Keltner Channel on the weekly chart
TSLA: Sold 2 contracts of 27Jan 250P at 3.55; Potential Profit = $710. Will close position if profit gets to $500 buying back at 0.80
NUGT: Waiting for price to pull to bottom of hourly Keltner to sell Puts
Profit last week = NUGT $227
Tip for Experienced Option Traders: Occasionally after a weekly trade goes against me but the trend appears to be changing I will add one naked contract over and above my foundation position and close this out after it gains at least half of the premium I’ve collected. Doing naked options is not for everyone and I keep my risk small by only doing one contract above my covered limit. In other words, if I can sell 4 contract covered by my long leaps I’ll sell one additional. This helps hedge the losses a bit but it this tactic is not without risk and must maintain a tighter stop than I would normally use with the regular position.
Note: We do our best to get both text alerts and email alerts out in a timely manner, occasionally there will be trades that are missed because of delay in the Text or Email alert applications. Additionally, please double check with your broker to assure they allow spread trades like we do with Strategy III. Some do and some don’t.
Additionally, it is crucial when selling premium against the Long LEAPS position that the premium collected cover the weekly cost of holding the LEAPS plus an additional amount to over this amount as a gain. This is one of the reason I sell premium of weekly options that are close to be “At the Money”. I base my selling on the expected move during the next week. If one is not bringing enough weekly premium this trade will not work out as well and may wind up being a losing trade.
Several members have asked about this strategy and a more detailed explanation is available in this updated video at: https://activetrendtrading.com/wealth-and-income-strategy/
I posted a video about how to choose the weekly options too short for this strategy. It can be viewed at: https://activetrendtrading.com/videos/
Additionally, some of these trades may be selling weekly puts on up trending stocks. If you are interested in parallel trading this strategy register at this link: http://forms.aweber.com/form/99/1278533099.htm
Early Warning Alerts for Leveraged Index ETFs: Last Trigger: 11/4—Waiting new signal or secondary trigger.
EWA Account Return for 2017: 0.09%
The Early Warning Alert Service alerted on all market lows in 2016. See the link below for the new video for 2016 that highlights entry refinements that will provide improved entries even in environment like 2016. In 2016 the entry triggers were challenging because of the number of straight off the bottom moves. Mike and I have analyzed this and have tested adjustments in place going forward.
EWA 2016 Update Video: https://activetrendtrading.com/early-warning-alerts-update-for-2016/
Potential Set Ups for this week: With the Indexes showing signs of weakness which could result in a more significant pullback, I’ll be watching to see which of the stocks On the Radar hold up. TSLA looks to have topped but earnings are on 2/8 which limits it’s potential to short term trades. Its uptrend is still in place so on any market rebound it may bounce. Again, short term trades would be out prior to the 8th.
CPE is holding up well of support at $15. Since oil tends to rally towards the end of February, CPE may drive sideways without much momentum until oil moves. NVDA has earnings on 2/9 AMC. The current move up is on below average volume. Taking a trade on a bounce from the 8 or 20 day EMA is doable but may not result in a big move. I opened ½ position in IDCC after a bounce from the 8/20 combo. Price action is holding at support at 92.20. With market weakness, I will not add to this position here. I’ll wait until T1 is hit and then go into a full position on a pullback.
Leveraged ETFs: If the RUT fails at support then look for a position in TZA. Biotech’s can show some strength during this time of the year so LABU may provide an upside opportunity if support holds at 35. I’m waiting for oils February consolidation to trade UCO. Lastly DUST & NUGT could go either way. With a weak market expect NUGT to bounce, but DUST has the better looking bottoming chart. In this case NUGT is sitting above the 50 day EMA which is a positive sign. Last year the gold miners started the upward surge the first week in February.
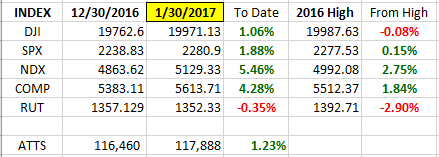
General Market Observation: Each of the three Tracking Indexes began pulling back today. Of significance was the gap down on both the SPX and NDX. The SPX shows an Island Top which clearly shows the upward momentum is waning. We must remember that each of the Indexes are still in an uptrend and looking for solid entries off pullbacks is warranted. However, being aware of the Historical Seasonality in a Post-Election year is also prudent. If price action follows the historical pattern the Indexes will be entering a weak period between now and late March and early April. On pullbacks, I will wait for the uptick in the TSI and Momentum. If current price action results in a thrust down taking out the 50 day moving averages, then I will evaluate the reaction move for a potential downside trade.
The SPX is pulling into support at the 2260 zone and holding above the 20 day EMA. Today’s candlestick is a Hammer but not at the end of a significant downtrend, so all it only tells us it that buyers came in just below the 20 and buoyed prices into the end of the day. Today’s gap down resulted in an Island Top which has connotations of weakness in the near-term.
The NDX also gapped down this morning finding support at the 5100 level. Price action finished back above the 8 day. Like the SPX the range of today’s negative price action was larger than recent daily moves. The daily TSI has now crossed down with Momentum also falling. The clues for the NDX are weak, but the uptrend is still in effect.
The RUT finished at the low side of the range established over the past several weeks. Price action bounced off the 50 day EMA but failed to finish in the upper half of the day’s range. We expect the RUT to be the weakest Index during the first part of the year, but price has not totally broken to the downside. Price continues to move sideways in a trading box between support at 1341 and resistance at 1384. Today’s price range was also larger than average. If the RUT takes out support I will look to trade to the downside using triggers off the 1-Hour Intraday Charts. A close below current support would increase the probability of a move back to the 100-day moving average currently at the 1303 level.

SPX: Downside Market Short the SPY, SPY Puts or SPXU.
Preferred Long ETF’s: SPY, UPRO and SPXL
NDX: Downside Market Short the QQQ, QQQ Puts or SQQQ.
Preferred Long ETF’s: QQQ and TQQQ
RUT: Downside Market Short the IWM, IWM Puts or TZA.
Preferred Long ETF’s: IWM and TNA
The How to Make Money Trading Stock Show—Free Webinar every Friday at 11:00 a.m. PDT. This weekly live and recorded webinar helped traders find great stocks and ETF’s to trade with excellent timing and helped them stay out of the market during times of weakness.
How to Make Money Trading Stocks on Friday, Feb 10th
Register now for the next live webinar at the link below:
Register Here: https://attendee.gotowebinar.com/register/7562489734728631809
Time 11:00 a.m. PDT
To get notifications of the newly recorded and posted How to Make Money Trading Stocks every week subscribe at the Market Tech Talk Channel: https://www.youtube.com/c/MarketTechTalk
Index Returns 2017 YTD
ATTS Returns for 2017 YTD
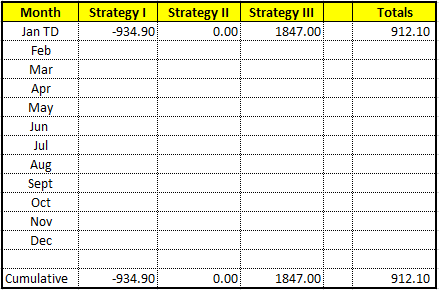
Percent invested initial $116K account: Strategies I & II invested at 13.76%; Strategy III invested at 26.6%.
Current Strategy Performance YTD (Closed Trades)
Strategy I: Down -$934.90
Strategy II: Up $0.0
Strategy III: Up $1847.00
Cumulative YTD: 0.78%
Active Trend Trading’s Yearly Objectives:
– Yearly Return of 40%
– 60% Winning Trades
– Early Warning Alert Target Yearly Return = 15% or better
For a complete view of specific trades closed visit the website at: https://activetrendtrading.com/current-positions/
Updated first full week of each month. The next update after first week in January.
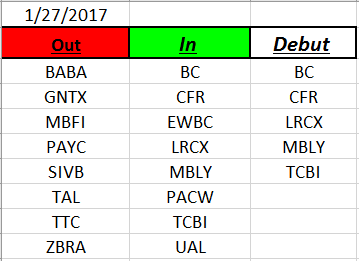
Outs & Ins: Five stocks debuted on the IB 50 this past week. BC, CFR, LRCX, MBLY and TCBI. For those who follow the IBD 50 you should recognize LRCX, CFR and MBLY list in the past. None of the added stocks floated to the top of the Fundamental Strength sort.
The Best of the Best from this weekend’s sort include IDCC, THO, CPE, NVDA, ESNT, GRUB and AMAT. GRUB and AMAT are new to the top list. IDCC, THO, CPE and NVDA are potentially strong candidates on proper pullbacks or consolidation patterns.
Share Your Success: Many of you have sent me notes regarding the success you are having with the Active Trend Trading System. Please send your stories to me at dww@activetrendtrading.com or leave a post on the website. Thanks.