Good Day Traders,
Overview & Highlights: Due to modification on the website by WordPress, spreadsheet files can no longer be uploaded. Moving forward the “Running List” and current “Premium List” will be provided as an attachment in the On the Radar and Trader’s Report weekly.
Tonight, President Trump address Congress and the Senate. We shall see if this provides any catalyst for tomorrow’s market.
I hope all members have seen some of the live Facebook broadcast. If you want notification of when these live market updates take place, please follow Active Trend Trading at: https://www.facebook.com/ActiveTrendTrading/
Upcoming Webinars: At Active Trend Trading we offer three webinars per week to provide training plus trade and market updates. See the schedule below for the next webinars.
The How to Make Money Trading Stock Show—Free Webinar every Friday at 11:00 a.m. PDT. This weekly live and recorded webinar helped traders find great stocks and ETF’s to trade with excellent timing and helped them stay out of the market during times of weakness.
How to Make Money Trading Stocks on Friday, March 3rd
Register now for the next live webinar at the link below:
Register Here: https://attendee.gotowebinar.com/register/385843200414302723
Time 11:00 a.m. PDT
Next Training Webinar: March 1st
For Premium Members, our Wednesday evening training is developing some fantastic traders
Topic: Early Warning Updates
** Friday’s “Final Hour”: March 3rd **
Time 12:00 p.m. PDT
For Premium Members, provides trades and set ups during the final hour of weekly trading.
Managing Current Trades: No Open Positions
Strategy II Basic Options:
Bought 3 contracts of NFLX 17Mar 140C at 5.25 on 2/22
For members wanting to better understand this Strategy there is a very good training video at: https://activetrendtrading.com/basic-option-strategy/
Strategy III Wealth & Income: Foundation positions are open in SPY, TSLA and NUGT. Total capital for Strategy III = 30% or $26.6K.
SPY: Waiting for setup at the upper or lower Keltner Channel on the weekly chart
TSLA: Waiting for setup at the upper or lower Keltner Channel on the weekly chart
NUGT: Sold 4 contracts 4Mar 10P at 0.55
Results from last week:
SPY: Loss = $157
TSLA: Profit = $599
NUGT: Profit = 0.00
Running Performance premium collected plus residual value of LEAPS
SPY: +14.25%
TSLA: +23.05%
NUGT: 12.65%
Combined: 18.54%
Tip for Experienced Option Traders: Occasionally after a weekly trade goes against me but the trend appears to be changing I will add one naked contract over and above my foundation position and close this out after it gains at least half of the premium I’ve collected. Doing naked options is not for everyone and I keep my risk small by only doing one contract above my covered limit. In other words, if I can sell 4 contract covered by my long leaps I’ll sell one additional. This helps hedge the losses a bit but it this tactic is not without risk and must maintain a tighter stop than I would normally use with the regular position.
Note: We do our best to get both text alerts and email alerts out in a timely manner, occasionally there will be trades that are missed because of delay in the Text or Email alert applications. Additionally, please double check with your broker to assure they allow spread trades like we do with Strategy III. Some do and some don’t.
Additionally, it is crucial when selling premium against the Long LEAPS position that the premium collected cover the weekly cost of holding the LEAPS plus an additional amount to over this amount as a gain. This is one of the reason I sell premium of weekly options that are close to be “At the Money”. I base my selling on the expected move during the next week. If one is not bringing enough weekly premium this trade will not work out as well and may wind up being a losing trade.
Several members have asked about this strategy and a more detailed explanation is available in this updated video at: https://activetrendtrading.com/wealth-and-income-strategy/
I posted a video about how to choose the weekly options too short for this strategy. It can be viewed at: https://activetrendtrading.com/videos/
Additionally, some of these trades may be selling weekly puts on up trending stocks. If you are interested in parallel trading this strategy register at this link: http://forms.aweber.com/form/99/1278533099.htm
Early Warning Alerts for Leveraged Index ETFs: Last Trigger: 11/4—Waiting new signal or secondary trigger.
EWA Account Return for 2017: 0.09%
The Early Warning Alert Service alerted on all market lows in 2016. See the link below for the new video for 2016 that highlights entry refinements that will provide improved entries even in environment like 2016. In 2016 the entry triggers were challenging because of the number of straight off the bottom moves. Mike and I have analyzed this and have tested adjustments in place going forward.
EWA 2016 Update Video: https://activetrendtrading.com/early-warning-alerts-update-for-2016/
Potential Set Ups for this week: TSLA continues to provide daily, weekly and monthly opportunities. Current price action is bouncing off a support zone between 242 and 240. A bounce back to the 8/20 day EMA combo would be a logical place for price action to turn around. This means a pushup to this level may provide an opportunity for downside trades. At the same time being ready for upside trades bouncing from the 50 day EMA would be a long side option. Look to trade TSLA for all three Strategies.
Current orders open to buy both ESNT and THO.
GOLD Miners: NUGT and DUST are the two leveraged ETFs we follow. DUST is breaking into an uptrend. This is due to the weakness in gold. If this works out per seasonality expect gold to continue weak through June-July. Watch pullbacks for entries on DUST.
Financials: FAS is in an uptrend matching XLF. Extended from the moving averages so wait for pullbacks for a move into the end of March.
Biotech’s: IBB is in a short-term uptrend and extended. Wait for pullbacks for LABU. Bio’s tend to top in late February. Which may provide a trade in LABD.
Oil: Even though in a slump for several years’ crude oil tends to rally after lows in February. At this point USO the non-leveraged ETF for oil is stuck in a tight price range. UCO is stuck in a similar range of 10%. Neither TSI or Momentum are trending!
Indexes: Covered in General Market Observations
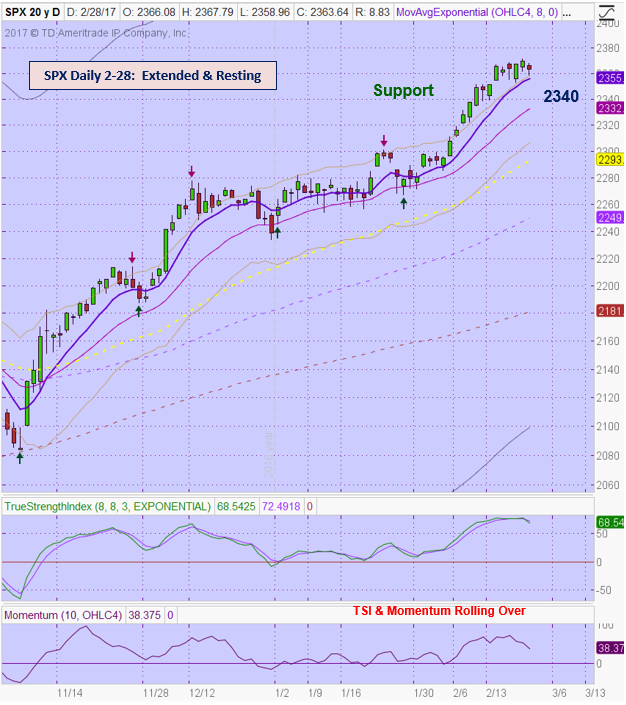
General Market Observation: The Dow dropped a bit today after 12 straight days up. While we don’t know if this marks a top or not, each of the Indexes do have something in common. Each Index shows daily TSI that has rolled over and in some cases crossed. This does not mean the top is in but it may mean that upside price action may be muted. For the 3 Tracking Indexes the Russell (RUT) is the weakest of the three. SPX and NDX are both holding up.
As seen on the SPX chart below, the reaction to the last thrust up has been a sideways move over the past 6 days. The uptrend remains intact so waiting for pullbacks would be in order. The most recent TSI rollovers have led to pullbacks resulting in buy opportunities. On should continue to plan to buy pullbacks until they stop working.
NDX similar action to SPX. The RUT is showing the most significant weakness. The breakout above 1392 has now been voided. Today’s price action closed below the 20 day EMA. Today was the largest down day in several months. Above average moves either up or down can telegraph a change in trend.
As I’ve said over the past few weeks, a weakening along the line so the historic post-election seasonality may still happen in March rather than February. If the growth objectives of the new administration appear to be bogging down may be the catalyst for more significant downside.
SPX: Downside Market Short the SPY, SPY Puts or SPXU.
Preferred Long ETF’s: SPY, UPRO and SPXL
NDX: Downside Market Short the QQQ, QQQ Puts or SQQQ.
Preferred Long ETF’s: QQQ and TQQQ
RUT: Downside Market Short the IWM, IWM Puts or TZA.
Preferred Long ETF’s: IWM and TNA
The How to Make Money Trading Stock Show—Free Webinar every Friday at 11:00 a.m. PDT. This weekly live and recorded webinar helped traders find great stocks and ETF’s to trade with excellent timing and helped them stay out of the market during times of weakness.
How to Make Money Trading Stocks on Friday, March 3rd
Register now for the next live webinar at the link below:
Register Here: https://attendee.gotowebinar.com/register/385843200414302723
Time 11:00 a.m. PDT
To get notifications of the newly recorded and posted How to Make Money Trading Stocks every week subscribe at the Market Tech Talk Channel: https://www.youtube.com/c/MarketTechTalk
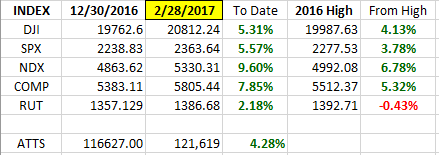
Index Returns 2017 YTD
ATTS Returns for 2017 YTD Closed Trades
Percent invested initial $116.6K account: Strategies I & II invested at 1%; Strategy III invested at 26.6%.
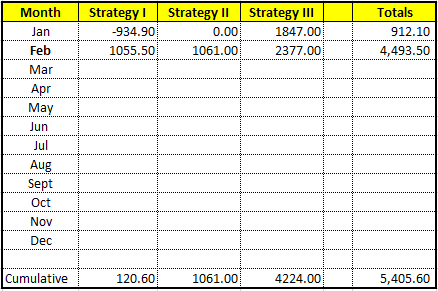
Current Strategy Performance YTD (Closed Trades)
Strategy I: Up $120.60
Strategy II: Up $1061.00
Strategy III: Up $4224.00
Cumulative YTD: 4.6%
Active Trend Trading’s Yearly Objectives:
– Yearly Return of 40%
– 60% Winning Trades
– Early Warning Alert Target Yearly Return = 15% or better
For a complete view of specific trades closed visit the website at: https://activetrendtrading.com/current-positions/
Updated first full week of each month. The next update after first week in March
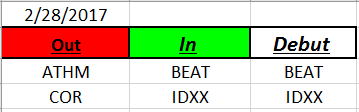
Outs & Ins: BEAT and IDXX make their debut on the IBD 50 mid-week. Only BEAT is in the process of pulling back.
The fundamental sort resulted in AEIS, ESNT and THO on top of the other 50 stocks. Keep an eye on NVDA. While it was hit hard last week it still rates as the 2nd place stock on the IBD 50. We shall see if things turn around!
Share Your Success: Many of you have sent me notes regarding the success you are having with the Active Trend Trading System. Please send your stories to me at dww@activetrendtrading.com or leave a post on the website. Thanks.