Good Day Traders,
Overview & Highlights: We are set up for a great trainings session on Wednesday this week and will be back on schedule with the Friday webinar. Mike has written a short but very timely article discussing other factors that have influenced SPX movement in the past. Currently the number of shares outstanding on the SPY is at extremes and in the past this has provided a heads up before the market corrected.
It’s a Fed week also, so will be holding off until Wednesday prior to going heavy in any direction.
Webinars: At Active Trend Trading we offer two webinars per week to provide training plus trade and market updates. See the schedule below for the next webinars.
How to Make Money Trading Stocks on Friday, July 29th—Friday week after next.
Register Here: https://attendee.gotowebinar.com/register/1191963339500657924
11:00 a.m. PDT
Next Training Webinar: July 27th
For Premium Members our Wednesday evening training is developing some fantastic traders!
Topic: Time and Price Symmetry
Managing Existing Trades: Positions open for 2 strategies.
Strategy I Portfolio Building: No Open Positions
Strategy II Income Generation:
Weekly Profit
GLD closed first ½ of 12 contract position: Profit Total of $786 on ½ of the position
Trade 1: GLD 19Aug 122/127C Debit Spread bought for $1.49 as a seasonal trade on Gold
Sold ¼ of 12 positions at $250 for a profit of $303
Sold second ¼ of 12 contract position on 7/1 at 3.10 profit = $483
Sell last ½ at $4.00 and $4.50 if price moves quickly. Trailing Stop at $2.50
For members wanting to better understand this Strategy there is a very good training video at: https://activetrendtrading.com/basic-option-strategy/
Strategy III Wealth & Income Generation Trades: Two Foundational Positions are in place to sell weekly options against. The recalculated weekly revenue needed from these foundational positions was forward in an update report earning last week. My objective with this Strategy is to collect enough weekly premium during the life of the LEAPS Strangle on both SPY and TSLA to both pay for the capital invested and gain between 50% – 100%.
Tip for Experienced Option Traders: Occasionally after a weekly trade goes against me but the trend appears to be changing I will add one naked contract over and above my foundation position and close this out after it gains at least half of the premium I’ve collected. Doing naked options is not for everyone and I keep my risk small by only doing one contract above my covered limit. In other words, if I can sell 4 contract covered by my long leaps I’ll sell one additional. This helps hedge the losses a bit but it this tactic is not without risk and must maintain a tighter stop than I would normally use with the regular position.
Note: We do our best to get both text alerts and email alerts out in a timely manner, occasionally there will be trades that are missed because of delay in the Text or Email alert applications. Additionally, please double check with your broker to assure they allow spread trades like we do with Strategy III. Some do and some don’t.
Additionally, it is crucial when selling premium against the Long LEAPS position that the premium collected cover the weekly cost of holding the LEAPS plus an additional amount to over this amount as a gain. This is one of the reason I sell premium of weekly options that are close to be “At The Money”. I base my selling on the expected move during the next week. If one is not bringing enough weekly premium this trade will not work out as well and may wind up being a losing trade.
Strategy III Weekly Results Week ending 7/22:
SPY: Profit = $56
TSLA: Profit = $712
Trade 1: Foundation Position is 4 contracts of SPY Jan17 205C and 4 contracts of SPY Jan17 200P Current Trade—Currently Up 16.38%; Premium Collected since opening trade on 1/4/16 = $4750
Waiting for weekly set up.
Trade 2: Long TSLA Jan17 250C & Long Jan17 220 + New Positions Jan17 210C and 220P: Current Position Total Invested $14,900.
Currently Up 81%: Premium Collected since opening trade on 9/28/15 = $13,629.50 + New Positions at $2,149.50 = Total Collected $15,779
Waiting for weekly set up.
Several members have asked about this strategy and a more detailed explanation is available at: https://activetrendtrading.com/wealth-and-income-strategy/
I posted a video about how to choose the weekly options to short for this strategy. It can be viewed at: https://activetrendtrading.com/videos/
Additionally, some of these trade may be selling weekly puts on up trending stocks. If you are interested in parallel trading this strategy register at this link: http://forms.aweber.com/form/99/1278533099.htm
Potential Set Ups for this week: Need some pullbacks to trigger upside buy action points. Some good candidates to watch, but none at a buy point.
Pre-Earnings Trade: Here are a list of stocks of interest that report this week and next. TSLA (8/3), FB (7/27), AMZN (7/28), GOOGL (7/28), and BIDU (7/28). We will see if these big names are punished like NFLX and see if they influence the market direction moving into August.
Other pre-earnings candidates include: OLED, PLNT, WBMD and CYBR.
Pre-earnings trades can be a great supplement to the portfolio building portion of Strategy I. Depending on the stock and technical analysis they tend to be predictable and repeatable. For busy traders focusing on pre-earning opportunities can free one up from the necessity of constantly chasing stocks during other periods of the year. The process repeats four times a year and capturing a 5%-15% return four times a year can compound very nicely!
Upside: Waiting for pullbacks on the Index ETF’s, ACIA & WOR.
Downside: NFLX & AVGO.
On the Radar: Stocks & ETFs that could go either way include: UPRO, SPXU, TQQQ, SQQQ, TNA, TZA & their associated non-leveraged Index ETFs. TSLA (Currently in downtrend channel), NFLX, BIDU, WYNN, PAYC, WBMD, XRS, MBLY, AMBA, PYPL, AVGO & NTES
Stocks identified by ** that are close to a potential entry point.
Early Warning Alerts for Leveraged Index ETFs: Standby Alert issued on 6/27.
EWA Account Return to date: 5.5%
New Video Update will be posted in July.
The Early Warning Alert Service hit all eight major market trading points in 2015. See this brief update video for more details: Early Warning Alerts Update Video or at https://youtu.be/GJwXCL4Sjl4
If simplifying your life by trading along with us using the index ETF is of interest, you can get the full background video at: https://activetrendtrading.com/etf-early-warning-alerts-video/
Mike’s Macro Market Musings: What is this chart telling us?
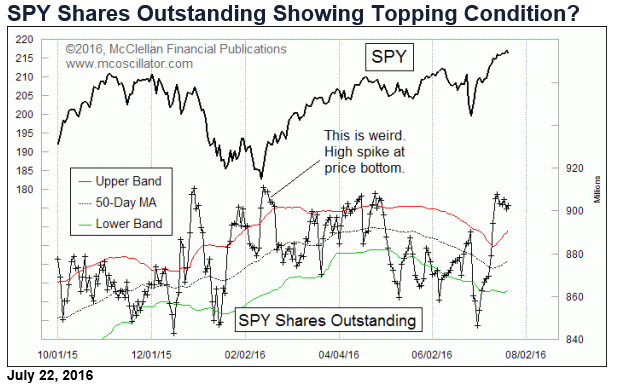
Keeping an eye on the number of shares outstanding in the equity index etf’s can provide useful information, especially at upper and lower extremes, and one of the best for this purpose is the biggest one, SPY. It tracks the SP500, and it currently has $196 billion invested in it. So it is a big deal.
The number of shares outstanding fluctuates with investor interest in the stock market. As more people start buying shares, the share price can start moving ahead of the net asset value (NAV), and so the sponsoring firm issues more shares, thereby keeping the share price and NAV as close as possible and increasing the number of shares outstanding. Likewise, when investors start selling, shares get redeemed and the number of shares outstanding declines. And in the process, we can get insights about investor sentiment when this data on shares outstanding gets to an extreme value.
But what is extreme? The numbers can trend higher and lower over time so using 50-1 Bollinger Bands can be helpful. That notation means setting up the Bollinger Bands on a chart displaying the number of outstanding SPY shares by using a 50-day moving average and 50-day standard deviation, and then the upper and lower bands are each set 1 standard deviation away from that moving average. The chart above shows how, at important short term peaks and valleys in the share price of SPY, the number of outstanding shares of SPY can move to extremes outside this Bollinger Band configuration in either direction.
The current reading is way up above the upper band. In fact, it is 3 standard deviations above that moving average right now. It is reminiscent of the sudden surge we saw back in December 2015, just before the sharp drop in early January 2016. This big rush into SPY says investors have suddenly become exceedingly interested in being invested in SPY lately, and whenever the crowd rushes in like this, it is a sign of excessive bullish sentiment.
If you want to track these data yourself, Interactive Data Corp. (parent company of eSignal and QCharts) has it under the symbol $SPY.SO. Yahoo! Finance also has it as SPY-SO although they do not seem to be able to chart it. SPY’s sponsoring firm makes it available on its web site, although not in historical form. Other services may have it as well; check with your data provider.
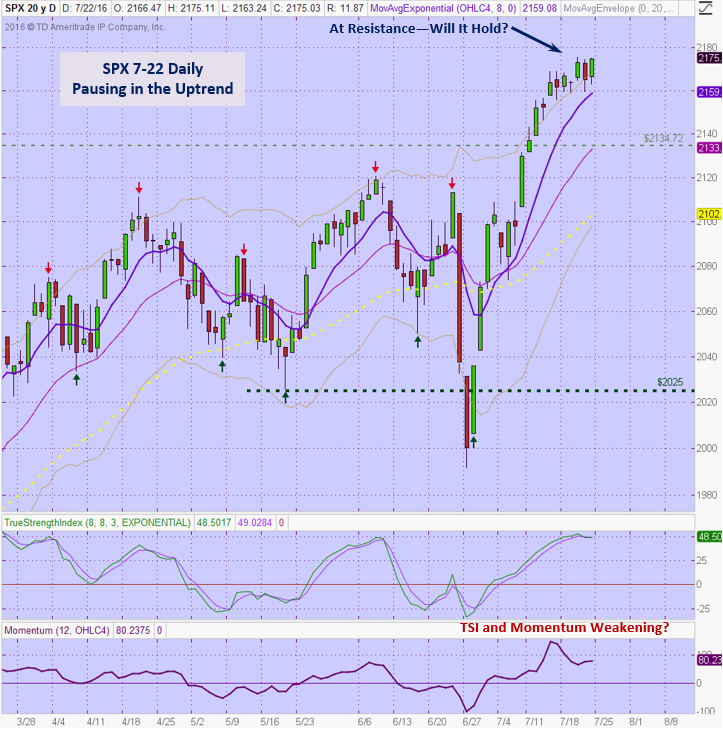
General Market Observation: Each of the 3 Tracking Indexes have provided a variation of a sideways move over the last couple of weeks. The strong uptrend has slowed or stopped but sellers have not showed up to drive price into even a good pullback. In Mike’s article above it speaks how over extended the SPY is with regard to shares outstanding. Oh the chart of the SPX price also remain extended above the Keltner Channel and the moving averages. The 8 day moving average is pushing up hard to catch price action but is not yet providing a clue as to whether the current uptrend will continue or a more significant pullback will take place. Resistance rest at the 2175 level and support at 2150. There are no active reversal signals.
The same scenario is working itself out in the other two Indexes as well. Along with some big name stocks reporting earnings this week, the Fed meets and reports out on Wednesday. Those in the know indicate that the chances of an interest rate hike are very slim for this meeting the verbiage in the report may provide stimulus to move the market one way or another. As typical I prefer to be lightly invested during up until Wednesday on Fed week, I’m also keeping in mind that over the past 5 years this point of the year tend to be weak. How weak? We shall see and of course it could be different this election year.
SPX: Downside Market Short the SPY, SPY Puts or SPXU.
Preferred Long ETF’s: SPY, UPRO and SPXL
NDX: Downside Market Short the QQQ, QQQ Puts or SQQQ.
Preferred Long ETF’s: QQQ and TQQQ
RUT: Downside Market Short the IWM, IWM Puts or TZA.
Preferred Long ETF’s: IWM and TNA
The How to Make Money Trading Stock Show—Note time change. This change will allow a full hour after the webinar to adjust trades. Free Webinar every Friday at 11:00 a.m. PDT. I’m looking for the best time to offer this webinar. I want to try closer to the close on Friday to see how that works out for potential trades going into the close. This weekly live and recorded webinar helped traders find great stocks and ETF’s to trade with excellent timing and helped them stay out of the market during times of weakness.
How to Make Money Trading Stocks on Friday, July 29th—Friday, week after next.
Register Here: https://attendee.gotowebinar.com/register/1191963339500657924
11:00 a.m. PDT
To get notifications of the newly recorded and posted How to Make Money Trading Stocks every week subscribe at the Market Tech Talk Channel: https://www.youtube.com/c/MarketTechTalk
Index Returns YTD 2016
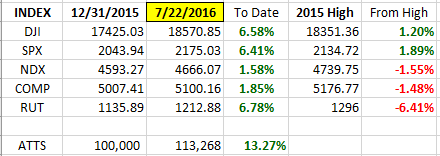
ATTS Returns for 2016 through July 22, 2016
Percent invested initial $100K account: Strategies I & II invested at 7.7%; Strategy III invested at 25.98%.
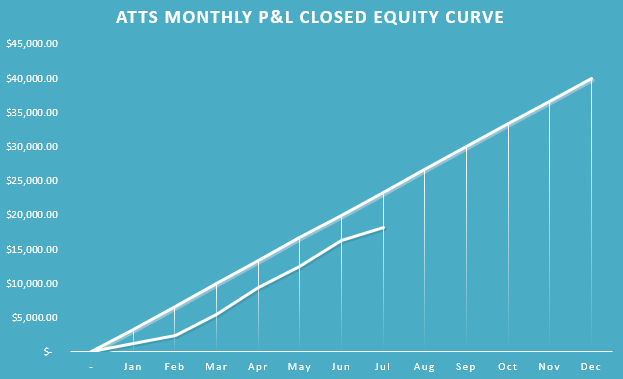
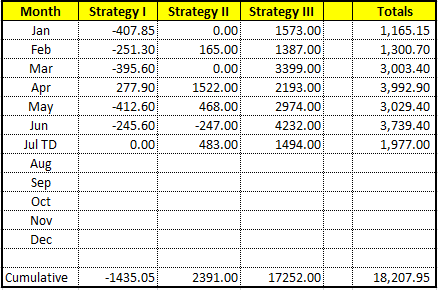
Current Strategy Performance YTD (Closed Trades)
Strategy I: Down -1435.05 or -2.05%
Strategy II: Up $2391.00 or +23.91%
Strategy III: Up $17252 or +63.6%
Cumulative YTD: 18.2%
Active Trend Trading’s Yearly Objectives:
– Yearly Return of 40%
– 60% Winning Trades
– Early Warning Alert Target Yearly Return = 15% or better
For a complete view of specific trades closed visit the website at: https://activetrendtrading.com/current-positions/
Updated first full week of each month. The next update August.
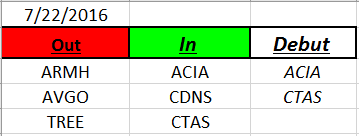
Outs & Ins: Two new stocks make an appearance on the IBD 50 list this weekend. ACIA and CTAS neither of which are in a buy position. ACIA just ran 94% in the last 24 days and CTAS broke out nicely after earnings last week. Both look like solid candidates but need a pullback to a proper action point.
Share Your Success: Many of you have sent me notes regarding the success you are having with the Active Trend Trading System. Please send your stories to me at dww@activetrendtrading.com or leave a post on the website. Thanks.