Good Day Traders,
Overview & Highlights: This week’s edition has a fantastic article by Mike Trager. Mike is a student of market history and some of what he reveals this week will give one a new perspective on what’s going on in the markets!
Looking forward to a huge month in April for all three Strategies. Wealth Building and Cash Flow Strategy III has been clicking all year so far. Portfolio building in Strategy I has been our laggard. I had a great discussion with a trader who concentrates on portfolio building this weekend. He said he has been totally in cash for the whole year and reiterated it is not a time for portfolio building, yet!
Webinars: At Active Trend Trading we offer two webinars per week to provide training plus trade and market updates. See the schedule below for the next webinars.
How to Make Money Trading Stocks on Friday, April 15th
Register Here: https://attendee.gotowebinar.com/register/6032474218174045953
Note this session will be at: 11:30 p.m. PDT
Next Training Webinar: April 13
For Premium Members our Wednesday evening training is developing some fantastic traders!
This week’s training will be open to everyone interested in trading. Please feel free to pass on this invitation to anyone you think would be interested.
Mid-Week Market Sanity Check Topic: When to Swing for Homerun Trades!
Register Here: https://attendee.gotowebinar.com/register/1270197987694757889
Managing Existing Trades: Positions open for all 3 strategies.
Strategy I Portfolio Building: Pre-earnings trade on PYPL, FB & XRS. Earnings on each are the last week in April
Bought 180 shares of PYPL at 38.09
T1 = 5% -10% to close 100 shares
T2 = Attempt to hold remaining shares up to earnings and then close
Stop Loss = 36.56
Bought 120 shares of FB at 113.55
T1 = 5% -10% to close 60 shares
T2 = Attempt to hold remaining shares up to earnings and then close
Stop Loss = 109.00
Bought 140 shares of XRS at 50.14
T1 = 5% -10% to close 70 shares
T2 = Attempt to hold remaining shares up to earnings and then close
Stop Loss = 48.13
Strategy II Income Generation: Open long PYPL Apr5 41C & FB Put Credit Spread
Profit last week = $0.0
Opened pre-earnings trade on PYPL. Bought 5 contracts of Apr5 41C at 0.60
Will close 3 contracts at 1.20 (100%) and hold the remainder up until earnings on 4/27 AMC
Opened pre-earnings spread on FB. Sold the Apr15 113P and sold the Apr15 116P for a net credit of 1.68. Total at risk 1.32 x 3 contracts.
Strategy II stocks of interest for this week: TSLA, SPX & Index ETFs.
For members wanting to better understand this Strategy there is a very good training video at: https://activetrendtrading.com/basic-option-strategy/
Strategy III Wealth & Income Generation Trades: Two Foundational Positions are in place to sell weekly options against. The recalculated weekly revenue needed from these foundational positions was forward in an update report earning last week. My objective with this Strategy is to collect enough weekly premium during the life of the LEAPS Strangle on both SPY and TSLA to both pay for the capital invested and gain between 50% – 100%.
Tip for Experienced Option Traders: Occasionally after a weekly trade goes against me but the trend appears to be changing I will add one naked contract over and above my foundation position and close this out after it gains at least half of the premium I’ve collected. Doing naked options is not for everyone and I keep my risk small by only doing one contract above my covered limit. In other words if I can sell 4 contract covered by my long leaps I’ll sell one additional. This helps hedge the losses a bit but it this tactic is not without risk and must maintain a tighter stop than I would normally use with the regular position.
Note: We do our best to get both text alerts and email alerts out in a timely manner, occasionally there will be trades that are missed because of delay in the Text or Email alert applications. Additionally please double check with your broker to assure they allow spread trades like we do with Strategy III. Some do and some don’t.
Week ending 4/8/16:
SPY: Profit + $410
TSLA: Down -$371
Trade 1: Foundation Position is 4 contracts of SPY Jan17 205C and 4 contracts of SPY Jan17 200P Current Trade—Currently Up 3.3%; Premium Collected since opening trade on 1/4/16 = $2530
No Short Positions—Waiting for Set Up
Trade 2: Long TSLA Jan17 250C & Long Jan17 220—Current Trade—Currently Up 43.92%; Premium Collected since opening trade on 9/28/15 = $8280
No Short Positions—Waiting for Set Up
Several members have asked about this strategy and a more detailed explanation is available at: https://activetrendtrading.com/wealth-and-income-strategy/
I posted a video about how to choose the weekly options to short for this strategy. It can be viewed at: https://activetrendtrading.com/videos/
Additionally some of these trade may be selling weekly puts on up trending stocks. If you are interested in parallel trading this strategy register at this link: http://forms.aweber.com/form/99/1278533099.htm
Pre-Earnings Trade: Some stocks will be setting up for the Q1 pre-earnings runs. In an up trending market many stocks will provide upside trades with expected returns between 5% – 20%. Here are some potential stocks that may provide pre-earning moves: PYPL, XRX, NFLX, SFM & FB.
Potential Set Ups for this week:
Upside: The stocks on the list are looking extended and ready for a healthy pullback that may be tradable depending on the strength of the Indexes. On good pullbacks or bounces from 8-20 day EMA’s SONC (inverted H&S pattern) and LGIH (retest around 25) look promising.
Downside: STMP, CALM, RGR & VRSK
On the Radar: Stocks & ETFs that could go either way include: UPRO, SPXU, TQQQ, SQQQ, TNA, TZA, TSLA (270 resistance/140 support), PYPL, AMZN, NFLX, ELLI, OLLI (Speculative), AHS, XRS, FB, AYI, OLED, RGR, NKE, SEDG (between 22-23), SBUX & LGIH
Stocks identified by ** that are close to a potential entry point.
Early Warning Alerts for Leveraged Index ETFs: Waiting for Second Chance Entry trigger and Alert reset.
The Early Warning Alert Service hit all eight major market trading points in 2015. See this brief update video for more details: Early Warning Alerts Update Video or at https://youtu.be/GJwXCL4Sjl4
If simplifying your life by trading along with us using the index ETF is of interest you can get the full background video at: https://activetrendtrading.com/etf-early-warning-alerts-video/
General Market Observation: For several weeks momentum has been falling as each of the 3 Tracking Indexes were pushing higher. The S&P and Nasdaq 100 progressed all the way up to the downtrend resistance line that defines the top of a downtrend channel that has contained all price action since July of 2015. Each of these Indexes flashed bearish reversal pattern on weekly charts so if these confirm we may see further downside this week. Depending on the Index the depth of the downtrend channel varies from 12% for the S&P to about 18% for the NDX. I would expect price action similar to the period between the first part of November and the end of December where price bounced around in a 4% channel with the tops forming the current resistance downtrend line.
The SPX weekly chart below shows this price action where one week would be hard down and the following week hard up but within the confines of the channel. If we get a symmetric type move now I expect prices to bounce around through the end of May (current earnings period) and then let go to the downside to move back down to the bottom of the larger downtrend channel.
If this expectation does work out then we will be ready to trade inverse leveraged index ETF’s or put options on the non-leveraged regular index ETF’s. Before committing totally I would like to see a bit more of a downward pullback to around the 38.2% retracement highlighted on the chart or a retest into last week’s price action to at least the 2060 level. This level is marked with the horizontal trend line at the mid-section of last week’s candle on the chart or the S&P.

The NDX is showing similar characteristics as the S&P. The Nasdaq Composite has already dropped the 200 day moving average. A 38.2% retracement for the NDX would take prices to the 4239 level which lines up with a previous support/resistance zone.
The Russell never made it to the 200 day moving average on the last rally and started weakening well ahead of the other two Tracking Indexes. This index may be the best bet for a downside trade. TZA is the inverse leveraged ETF.
SPX: Downside Market Short the SPY, SPY Puts or SPXU.
Preferred Long ETF’s: SPY, UPRO and SPXL
NDX: Downside Market Short the QQQ, QQQ Puts or SQQQ.
Preferred Long ETF’s: QQQ and TQQQ
RUT: Downside Market Short the IWM, IWM Puts or TZA.
Preferred Long ETF’s: IWM and TNA
The How to Make Money Trading Stock Show—Free Webinar every Friday at 11:30 a.m. PDT. I’m looking for the best time to offer this webinar. I want to try closer to the close on Friday to see how that works out for potential trades going into the close. This weekly live and recorded webinar helped traders find great stocks and ETF’s to trade with excellent timing and helped them stay out of the market during times of weakness.
How to Make Money Trading Stocks on Friday, April 15th
Register Here: https://attendee.gotowebinar.com/register/6032474218174045953
Note this session will be at: 11:30 p.m. PDT
To get notifications of the newly recorded and posted How to Make Money Trading Stocks every week subscribe at the Market Tech Talk Channel: https://www.youtube.com/channel/UCLK-GdCSCGTo5IN2hvuDP0w
– The Active Trend Trader Referral Affiliate Program is ready. For more information or to become an Affiliate please register here: https://activetrendtrading.com/affiliates-sign-up-and-login/
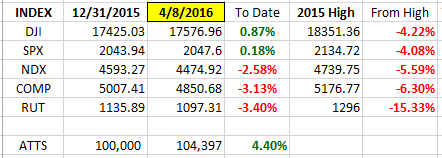
Index Returns YTD 2016
I’ve added a column to the Index YTD performance chart. The column on the far right shows the depth of the current correction with respect to the highs of the top from 2015. Note both DJI & SPX are now in positive territory for 2016.
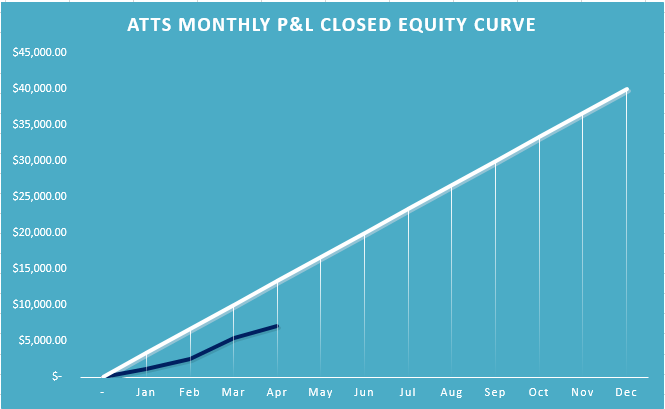
ATTS Returns for 2016 through April 8, 2016
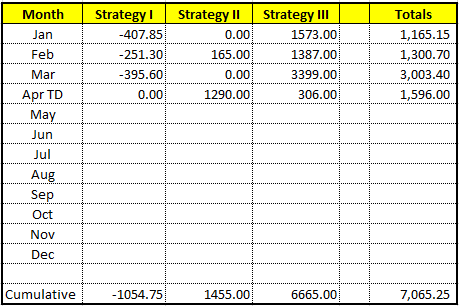
Percent invested $100K account: Strategies I & II invested at 0%; Strategy III invested at 20%.
Current Strategy Performance YTD (Closed Trades)
Strategy I: Down -1054.75 or -1.05%
Strategy II: Up $1455 or 14.55%
Strategy III: Up $6626 or +33.1%
Cumulative YTD: 7.06%
Active Trend Trading’s Yearly Objectives:
– Yearly Return of 40%
– 60% Winning Trades
– Early Warning Alert Target Yearly Return = 15% or better
For a complete view of specific trades closed visit the website at: https://activetrendtrading.com/current-positions/
Updated first full week of each month
For our all Active Trend Trading Members here’s how we utilize our trading capital
Trading Capital Setup and Position Sizing: Every year we start the year off trading a $100K margin account split up into the three strategies used with the Active Trend Trading System.
– Each trader must define their own trading capital in order to properly size trade positions to meet their own risk tolerance level!
– Strategy I: Capital Growth—70% of capital which equates to $140K at full margin. This strategy trades IBD Quality Growth Stocks and Index ETFs. Growth Target 40% per year.
– Strategy II: Short Term Income or Cash Flow—10% of capital or $10K. This strategy focuses on trading options on stocks and ETF’s identified in Strategy I. The $10K will be divided into $2K units per trade.
– Strategy III: Combination of Growth and Income—20% of capital or $20K. This strategy will use LEAPS options as a foundation to sell weekly option positions with the intent of covering cost of long LEAPS plus growth and income.
– The $70K Strategy I portion of the trade account is split between up to 4 stocks and potentially a leveraged Index ETF. Actual number of shares will vary of course depending on price of the entity traded and amount of margin available. We have found that limiting open positions to only 5 entities greatly reduces the trade management time requirements for members.
– Naked Puts or short term options strategies will be used occasionally for Income Generating Positions
– None of the trade setups are recommendations to trade only notification of planned trades from set ups using the Active Trend Trading System. Each trader is responsible for establishing their own appropriate risk level if they decide to parallel trade.
– The Active Trend Trading System objective is to provide a clear and simple system designed for members who work full time.
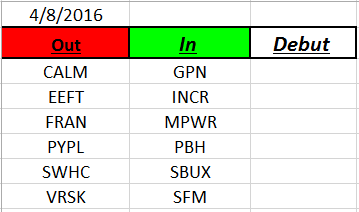
Outs & Ins: No new debuts on the IBD 50 list this weekend. Earnings will start up again in earnest shortly so I’ll be looking for pre-earnings trading opportunities. This week most of the IBD 50 stocks are showing signs of being extended and that it may be time for a pullback. Look for the majority of the stocks on the list to trade in the direction of the indexes. If the indexes continue to weaken watch for those stocks that are holding up or going against the flow to identify potential leaders.
Share Your Success: Many of you have sent me notes regarding the success you are having with the Active Trend Trading System. Please send your stories to me at dww@activetrendtrading.com or leave a post on the website. Thanks.