Good Day Traders,
This week I will post the clear and simple rules I’ll use to do basic option trades. I will set aside 10% of the trading capital ($10,000) for option trades. Like our other Alerts I will text out an Alert indicating what option I will trade with the stop and profit target and follow that with an email alert.
Option trades have a high potential for both gain and loss, so this feature will be secondary to the main focus of Active Trend Trading. This focus will be using the system for trading individual stocks and Index ETF’s so I will not be providing a lot of training on options.
I will go over the Option plan this Wednesday night on the Mid-Week Market Sanity Check Training so don’t miss this event if you are interested in how we will apply this simple strategy to the Active Trend Trading System.
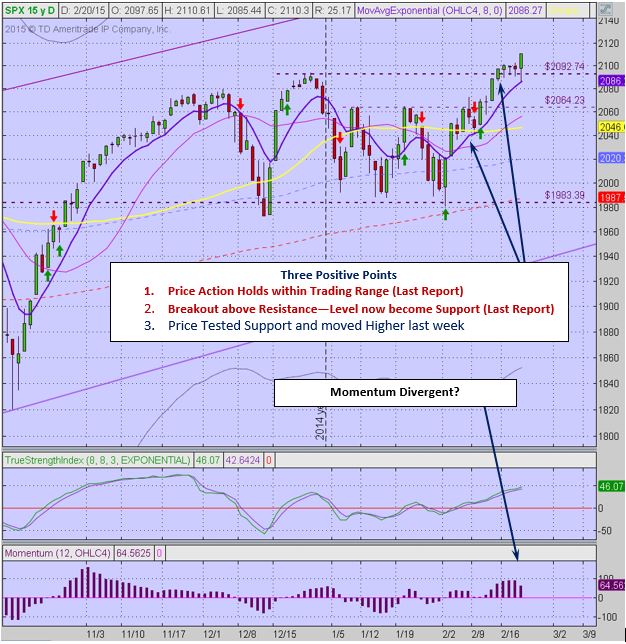
General Market Observation: Each of the Indexes’ weekly chart show TSI and Momentum with negative divergences, but price continues to push higher into free airspace. Both of these indicators measure internal aspects of what’s going on in a price move. Remember that even when the indicators are negative price action can still move a lot higher. The clue that negative divergence provides while price moves higher is that the advance is facing headwinds because not all stocks in the Index are participating in the upward surge. Eventually this weight leads to at least a pull back and often time a correction.
SPX: Support at 2090 held all week and then Friday a sell off to the 8 day EMA turned into an upside move back above the 2090 level and on to new highs. The indecisive Dojis present on Wednesday and Thursday resolved to the upside. For the time being Price Action has voted to go higher. While one could have traded the Index ETF off the 8 day EMA Friday, this particular trade would not have been a high probability trade. Price is stretched from the 20 day SMA thus making an entry here more risky. If a trader does design a trade bouncing from the 8 day EMA remember the stop loss should be place slightly below the 8 day EMA when price is extended above the stronger moving averages.
NDX: Price action on the Nasdaq 100 moved up all 4 days last week. The current price level is just over 8% away from the all-time high set in March 2000 at 4816.35. Last week’s price action moved into the top half of the long term trend channel that has been in place for since 2012. Like the S&P we will not argue with Price Action because the current path of least resistance in up. Price action on the NDX is stronger than the other Indexes.
RUT: The Russell’s strength is in between the other two tracking Indexes. Nice bounce off the 8 day EMA on Friday so the trading comments on the SPX above are relevant. Price action has broken into free airspace so even with negative divergence on Weekly indicators there is no resistance above current prices. Eventually the price action will run out of steam and gravity will take over. The clues of “when of this will happen” have not yet been revealed.
_________________________________________________________
If you have not had a chance to check out the research Mike Trager and I have done to start the EWA service you can find a short 10 minute preview at: http://youtu.be/MgC9GMAWh4w
If simplifying your life by trading along with us using the index ETF is of interest you can get the full background video at: https://activetrendtrading.com/etf-early-warning-alerts-video/
Remember if you are a premium or Early Warning Alert member you can receive Text Alerts and Trade Notifications if you send us your mobile phone number. Sent us your number with NO HYPHENS please and we’ll get you on the Text Notification List.
The How to Make Money Trading Stock Show—Free Webinar every Friday at 10 a.m. PDT. This weekly live and recorded webinar helped traders find great stocks and ETF’s to trade with excellent timing and helped them stay out of the market during times of weakness.
The “How to Make Money Trading Stocks” Show is back this Friday, February 20th. Ensure you get a seat by registering now at: https://attendee.gotowebinar.com/register/2524524142061639937
To get notifications of the newly recorded and posted Market Stock Talk every week subscribe at the Market Tech Talk Channel: https://www.youtube.com/channel/UCLK-GdCSCGTo5IN2hvuDP0w
- The Active Trend Trader Affiliate Program is ready. For more information or to become an Affiliate please register here: https://activetrendtrading.com/affiliates-sign-up-and-login/
Summary of Monthly Closed Trades as of the Feb 20th:
Less than 1% invested.
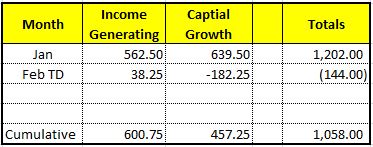
Total Booked Profits since Jan 1 when the timing service began: $1,058.00
_______________________________________________________________
ATTS Returns for 2015 through Feb 20th
Margin Account = +1.1%
IRA Account = +4.7% (currently trading the IRA with the same rules but have been testing out the Option Strategies we’re introducing this week)
Early Warning Alerts = +1.97%
Active Trend Trading’s Yearly Objectives:
– Yearly Return of 40%
– 60% Winning Trades
For a complete view of specific trades closed visit the website at: https://activetrendtrading.com/current-positions/
Updated at the beginning of each month.
For our all Active Trend Trading Members here’s how we utilize our trading capital
Trading Capital Setup and Position Sizing: Every year we start the year off trading a $100K margin account make the math really easy for yearly returns.
- Each trader must define their own trading capital in order to properly size trade positions to their own risk tolerance level!
The $100K account is split between up to 4 stocks and a leveraged Index ETF. Actual number of shares will vary of course depending on price of the entity traded. We have found that limiting open positions to only 5 entities greatly reduces the trade management time requirements for members. This goes back to our goals of providing a system designed for members who work full time.
- Regardless of market conditions no more than 50% of available margin is used at any time.
- Each Trade is split 50-50 between Income Generating & Capital Growth Objectives unless specified in the Order Alert
- Naked Puts or short term options strategies will be used occasionally for Income Generating Positions
- None of the trade setups are a recommendation to trade only notification of planned trades from set ups using the Active Trend Trading System. Each trader is responsible for establishing their own appropriate risk level on every trade.
Managing Existing Trades: NOAH reports earnings after the market close on February 26th Thursday. Half of the position was closed out for a profit over 7% and the remaining shares will be closed either break even or just prior to the close on Thursday. A One Cancels Other (OCO) order is in place that execute on a drop of price to breakeven or close at five minutes before the close on the 26th.
With an OCO order if either of the orders execute the remaining order is automatically cancelled. This type of order allows traders to design a trade that cover both potential outcomes.
Pre-Earnings Trade: AMBA sold off with GPRO but has found some support at $48. Earnings are on March 3rd after the market. Take a look at the weekly chart on GPRO and AMBA, clearly AMBA remains in an uptrend that is bouncing at the 100 day SMA. A 5-15% run prior to earnings could be a potential especially as the sympathy move with GPRO losses influence. Additionally HABT & GLOG may stage a pre-earning run. Both of these are sleepers to the upside and worth watching. GLOG reports 2/27 BMO but HABT report 3/10 so a pre-earning on HABT might be a stronger possibility.
Potential Set Ups for this week: The stocks identified in this section may not be at a proper entry action point but each may be worth waiting for. Three stocks may be ready this week including, GNTX, ALGN & AFSI to the upside.
Upside: The following stocks look to have good upside potential when they provide a proper entry action point. These include: ALK, SWFT, SWKS, VIPS & VDSI.
Downside: The new coffee maker from GMCR is a pain and costly to maintain if one keeps to the descaling schedule that the onboard computer calls for. I’ll be looking for an opportunity to pay for my K-Cups with a bearish trade here. QIHU continues to fail and has dropped another level of support.
Toss Ups: TSLA remains on the list because TSLA is an excellent trading stock. Look at last week’s move. The move was over 8% and $16. TSLA continues to put in great patterns and respects horizontal levels of support and resistance. TSLA has slipped off the radar as a solid IBD Stock, but it is still a stock with a lot of emotion behind it which translates to great short term trading opportunities. The key to trading TSLA is to be in synch with the price movement.
Other Toss Ups include: XRS, BIDU, LNKD, TSLA, GILD & YY.
Coming on the Radar: I’m going to use this section for highlighting stocks I find during my weekend review of the Market Smith’s Growth 250 list. Some of the insights I’ve gained on how best to use this information has pointed out a couple of stocks like NOAH, HABT early in their moves before the show up one of the published lists…in other words when current price is not over extended. This will greatly benefit ATTS members because getting these stocks early may lead early entries before the crowd. Here is a short list of stocks I mined this weekend: GRUB, CRM, RYL, SAVE, ETE, KNX, HAIN, ZAYO, JD & PAYC.
Comments and opinions written below this line of text may be provocative and only obliquely related to trading. Some may find these “Off the Wall” comments challenging to their outlook on life. I will not post any comments made on subject matter below this line, so if you disagree blast away.
OFF THE WALL

Off the Wall: I was chatting with my trading research partner Mike Trager earlier today discussing his upcoming BAMM presentation on Market Cycles. Our conversation drifted off on to some of the more bizarre cycles some traders track. Did you know that some traders actually track cycles based on sun spots to determine their trading posture? Some traders track astrological star patterns for theirs. There are even some who track the Shmita 7 Year cycle. It just happens that 2015 is a Shmita Year per the Jewish calendar. The Shmita year is intended to be a year of rest when the ground was left fallow and no crops were planted. Some financial folks believe that this seven year cycle can often be a time when something devastating will happen in the financial markets. The year covers a period from September to September with the really bad stuff typically happening towards the end of the year.
What’s interesting is that if this is a Shmita Year then going back several 7 year cycles may be revealing. This first jump back 7 years returns us to 2008. Did anything financially devastating happen in 2008? Well in September of 2008 the market finally melted down with the S&P falling over 44% from support at 1200. Then 7 years before 2008 was 2001. Anything negative happen in September 2001? There was a selloff of over 10% when the market opened after 9/11. If we continue back down memory lane we find that there was an 8% correction early in 1994 with the market being flat all year. Of course don’t forget about 1987.
Now I’m not the cycle guy but this is kind of interesting at first glance. What are the odds of something negative happening in the market every 7 years mostly around September? If there is something to the 7 year cycle do we run and hide in the closet? No and the reason why is very simple. In each of these years the convergence of clues on the charts were already showing the wise trader that it was not time to be long the market! The wise trader would have already been either short or totally out of the market prior to the meltdown. So if this the year—the clues will converge!
Additionally after each most of the significant market drops the slate was purged of access and the rebounds provided some of the best trading opportunities of the decade. As I like to say, “We will see!”
Share Your Success: Many of you have sent me notes regarding the success you are having with the Active Trend Trading System. Please send your stories to me at dww@activetrendtrading.com or leave a post on the website. Thanks!