Good Day Traders,
Overview & Highlights: Over the next several weeks I will be refreshing and re-recording the basic training videos for the Active Trend Trading System (ATTS). The intent is to provide a more straight forward training process that will help members learn the system more quickly. I’ll be posting updates as these videos come online.
Webinars: At Active Trend Trading we offer two webinars per week to provide training plus trade and market updates. See the schedule below for the next webinars.
How to Make Money Trading Stocks on Friday, Feb 19th
Register Here: https://attendee.gotowebinar.com/register/4146720515834936834
Next Training Webinar: Feb 16th
For Premium Members our Mid-Week evening training is developing some fantastic traders!
Mid-Week Market Sanity Check Topic: Strategy III: Earning Little-by-Little
Managing Existing Trades: Current trades are for Strategy III. Waiting for set-ups for Strategy I & II.
Strategy I Portfolio Building: No Open Trades.
Strategy II Income Generation: No Open Trades—if you trade options this is a good strategy to send up trial trades to see if the market’s direction may be changing. 1-5 contracts of one of the Index ETFs may provide less downside risk than long position in the underlying Index ETF. Trading options is not for everyone and I strongly encourage members to first become successful trading stocks and ETFs.
For members wanting to better understand this Strategy there is a very good training video at: https://activetrendtrading.com/basic-option-strategy/
Strategy III Wealth & Income Generation Trades: Two Foundational Positions are in place to sell weekly options against. The recalculated weekly revenue needed from these foundational positions was forward in an update report earning last week. My objective with this Strategy is to collect enough weekly premium during the life of the LEAPS Strangle on both SPY and TSLA to both pay for the capital invested and gain between 50% – 100%.
Note: We do our best to get both text alerts and email alerts out in a timely manner, occasionally there will be trades that are missed because of delay in the Text or Email alert applications. Additionally please double check with your broker to assure they allow spread trades like we do with Strategy III. Some do and some don’t.
Trade 1: Foundation Position is 4 contracts of SPY Jan17 205C and 4 contracts of SPY Jan17 200P Current Trade—Currently Up 23%
Sold 2 contract of SPY Feb 188C at 1.1 worth $110 per contract
Sold 2 contract of SPY Feb 188C at 1.1 worth $110 per contract
Weekly Potential Profit = $440
Trade 2: Long TSLA Jan17 250C & Long Jan17 220—Current Trade—Currently Up 43%
Sold 1 contract of TSLA Feb 157.5C at 2.215 worth $221.50 per contract
Weekly Potential Profit = $221.50
Several members have asked about this strategy and a more detailed explanation is available at: https://activetrendtrading.com/wealth-and-income-strategy/
I posted a video about how to choose the weekly options to short for this strategy. It can be viewed at: https://activetrendtrading.com/videos/
Additionally some of these trade may be selling weekly puts on up trending stocks. If you are interested in parallel trading this strategy register at this link: http://forms.aweber.com/form/99/1278533099.htm
Pre-Earnings Trade: Only a few more weeks left in the current earnings season. Due to the weakness in the market few stocks have provided solid pre-earning runs. Additionally few have provided solid set-ups from which to enter trades. In an up trending market many stocks will provide upside trades with expected returns between 5% – 20%. Here are some potential stocks that may provide pre-earning moves: CRI, NTES, SWHC, STOR, AVGO & ROST
Potential Set Ups for this week: Long set ups continue to be in short supply, but many stocks are showing some signs of positive divergence. With the current market personality choosing one or two stocks and Index ETF’s is a good way to stay focused with potential short term trades for both Strategy I and Strategy II. I like TSLA and the Index ETFs for this focus currently and will look specifically for trades in each of these until the market’s personality changes.
Upside: Bases are being built but no early triggers.
Downside: AMZN, FB, NFLX & LNKD. Waiting for bounce downs near the 8 week EMA for short entries.
On the Radar: Stocks & ETFs that could go either way include: UPRO, SPXU, TQQQ, SQQQ, TNA, TZA, TSLA (160 resistance/140 support), GGAL, HA, HII, XRS**, STZ & SEDG
Stocks identified by ** are holding up well and may be upside movers if the market strengthens.
Early Warning Alerts for Leveraged Index ETFs: Waiting for Alert and entry trigger.
The Early Warning Alert Service hit all eight major market trading points in 2015. See this brief update video for more details: Early Warning Alerts Update Video or at https://youtu.be/GJwXCL4Sjl4
If simplifying your life by trading along with us using the index ETF is of interest you can get the full background video at: https://activetrendtrading.com/etf-early-warning-alerts-video/
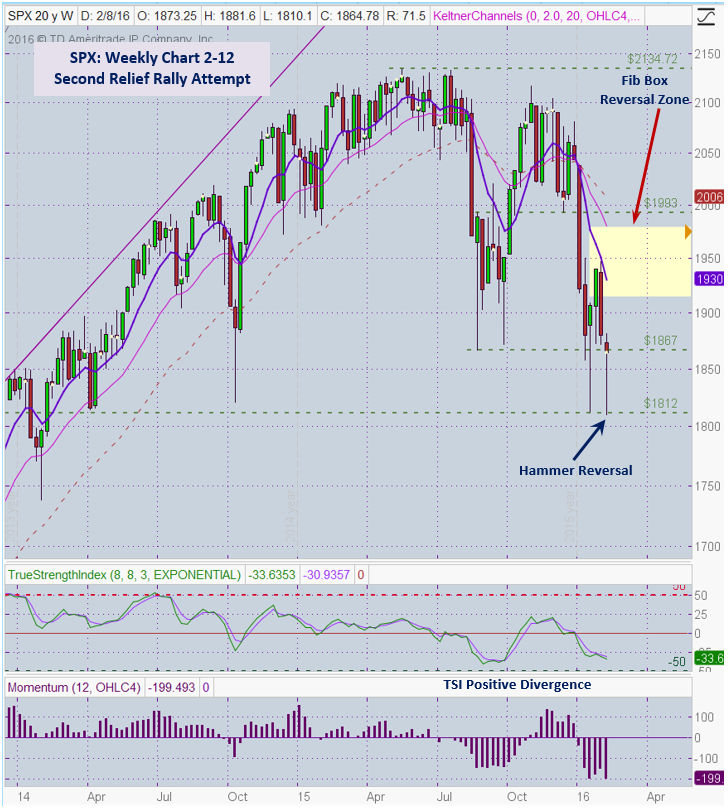
General Market Observation: Each of the Tracking Indexes dropped to new lows last week and then began a rally attempt on Thursday. Weekly price action on the S&P ended the week with a Bullish Hammer reversal signal. This week’s hammer was less robust than the hammer that appeared the week of 1/18 but it does show us exactly where strong support is currently residing. Buyers came in to buoy the market at the 1812 level. This support level has been in place since 2014. Several clues are in place that favor at least a relief rally in the near term. These include extension from the 8 week and 20 week EMAs, positive divergences weekly and daily charts for TSI, positive divergence on daily Momentum and time symmetry. A chart that shows tradable patterns often shows both price and time symmetry. This symmetry provides clues as to timing of bounces at both support and resistance.
Price action on the S&P closed just below resistance at 1867 and the 8 day EMA. A breakout above this level will run into resistance between the 1875-1900 levels and at the Fib Box (1950 mid-section). Thus a gap up breakout countertrend move on the Index ETF would be gapping into resistance. With both all the daily and weekly moving averages showing a bearish stack and pointed down we can use any stalling at the moving averages as potential short triggers.
While weaker than the S&P, both the NDX and RUT found levels of support last week and are trying to rally. Both are showing some positive divergence on the daily and weekly charts after make new lows in the current downtrend. Watch both the 8 & 20 period EMA’s on the daily and weekly charts for potential downside trades. For upside trades I’ll be watching retest into last week’s candle stick.
SPX: Downside Market Short the SPY, SPY Puts or SPXU.
Preferred Long ETF’s: SPY, UPRO and SPXL
NDX: Downside Market Short the QQQ, QQQ Puts or SQQQ.
Preferred Long ETF’s: QQQ and TQQQ
RUT: Downside Market Short the IWM, IWM Puts or TZA.
Preferred Long ETF’s: IWM and TNA
The How to Make Money Trading Stock Show—Free Webinar every Friday at 10 a.m. PDT. This weekly live and recorded webinar helped traders find great stocks and ETF’s to trade with excellent timing and helped them stay out of the market during times of weakness.
How to Make Money Trading Stocks on Friday, Feb 19th
Register Here: https://attendee.gotowebinar.com/register/4146720515834936834
To get notifications of the newly recorded and posted How to Make Money Trading Stocks every week subscribe at the Market Tech Talk Channel: https://www.youtube.com/channel/UCLK-GdCSCGTo5IN2hvuDP0w
- The Active Trend Trader Referral Affiliate Program is ready. For more information or to become an Affiliate please register here: https://activetrendtrading.com/affiliates-sign-up-and-login/
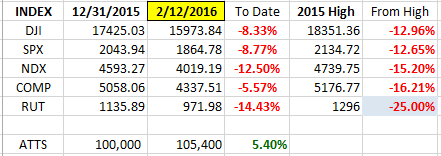
Index Returns YTD 2016
I’ve added a column to the Index YTD performance chart. The column on the far right shows the depth of the current correction with respect to the highs of the top from 2015. Currently RUT is in Bear Market Territory.
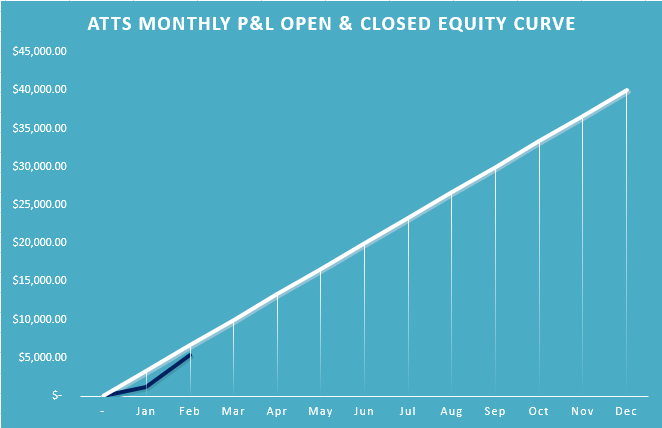
ATTS Returns for 2016 through Feb 12, 2016
Percent invested $100K account: Strategies I & II invested at 0%; Strategy III invested at 20%.
Current Strategy Performance YTD (Closed Trades)
Strategy I: Down -407.85 or -0.58%
Strategy II: 1.65%
Strategy III: Up $5235 or +26%
Cumulative YTD: 5.4%
Active Trend Trading’s Yearly Objectives:
- Yearly Return of 40%
- 60% Winning Trades
- Early Warning Alert Target Yearly Return = 15% or better
For a complete view of specific trades closed visit the website at: https://activetrendtrading.com/current-positions/
Updated first full week of each month.
For our all Active Trend Trading Members here’s how we utilize our trading capital
Trading Capital Setup and Position Sizing: Every year we start the year off trading a $100K margin account split up into the three strategies used with the Active Trend Trading System.
- Each trader must define their own trading capital in order to properly size trade positions to meet their own risk tolerance level
- Strategy I: Capital Growth—70% of capital which equates to $140K at full margin. This strategy trades IBD Quality Growth Stocks and Index ETFs. Growth Target 40% per year.
- Strategy II: Short Term Income or Cash Flow—10% of capital or $10K. This strategy focuses on trading options on stocks and ETF’s identified in Strategy I. The $10K will be divided into $2K units per trade.
- Strategy III: Combination of Growth and Income—20% of capital or $20K. This strategy will use LEAPS options as a foundation to sell weekly option positions with the intent of covering cost of long LEAPS plus growth and income.
The $70K Strategy I portion of the trade account is split between up to 4 stocks and potentially a leveraged Index ETF. Actual number of shares will vary of course depending on price of the entity traded and amount of margin available. We have found that limiting open positions to only 5 entities greatly reduces the trade management time requirements for members.
- Naked Puts or short term options strategies will be used occasionally for Income Generating Positions
- None of the trade setups are recommendations to trade only notification of planned trades from set ups using the Active Trend Trading System. Each trader is responsible for establishing their own appropriate risk level if they decide to parallel trade.
- The Active Trend Trading System objective is to provide a clear and simple system designed for members who work full time.
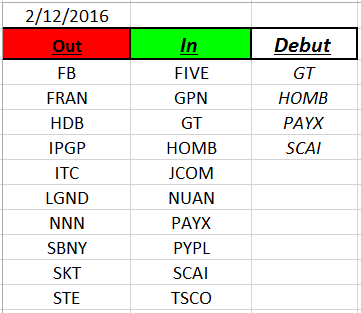
Outs & Ins: The IBD 50 has had a swing door this year with stocks of questionable strength moving onto the list and off the list quickly. To date 129 stocks have been on the list. Part of the reason for such large movement is the purge of stocks from the first list of the year. Growth stocks fell out of favor and institutions started moving into more defensive stocks.
This week GT, HOMB, PAYX and SCAI make their debut. With weak markets occasionally non-growth stocks pass the screen test and make it on the IBD 50. GT which is Goodyear Tire and Rubber is a good example of how a stocks with questionable growth potential slips through. This demonstrates how investors are looking to play defense rather than offense. With GT paying a dividend of over 4% the stability becomes attractive. Another clue related to the IBD 50 is stocks showing up on the Leaderboard. This week the Utilities ETF XLU and AT&T showed up. Are these stocks truly leaders from a growth perspective? I think not, but they do make good defensive holdings.
SCAI looks to have some potential as it builds its current base. It reports earnings on 2/16 BMO.
Share Your Success: Many of you have sent me notes regarding the success you are having with the Active Trend Trading System. Please send your stories to me at dww@activetrendtrading.com or leave a post on the website. Thanks.