August 14th,
Today’s post has the regular update on the IBD 50, Running List and other watch list reviewed. Additionally, we have an editorial by Mike Trager. Mike’s Macro Market Musing for this edition is:
Mike’s Macro Market Musing: A Simple Long Term Trend Following Strategy – Update
I have written before about, and illustrated, a very simple and extraordinarily effective long term strategy utilizing monthly charts and a very simple moving average trend following methodology that has historically enjoyed a phenomenal profit factor and continues to do so. It has been several months since we last looked at this, so let’s see where things are at currently
The strategy involves nothing more than buying the indexes (we’ll look at the S&P 500, aka SPX, for an example) or their derivatives when price closes above the 10 period simple moving average on a monthly chart (which is roughly equivalent to the 200 day sma on a daily chart and a 40 week sma on a weekly chart) and holding the position until price closes below the 10 month sma, at which time the position is sold. This is a long only strategy in keeping with the long term upward bias in the stock market indexes. As with any true trend following technique, there is no attempt made to time tops and bottoms in the markets. There is no need to follow financial or economic news, earnings, individual stocks, valuation metrics, or anything of the sort, unless one wants to do so. Not in the least bit sexy or exciting. None of that matters. The only thing that matters is the index price and where it is relative to the 10 month sma. All one needs to do is look at the closing price of the index on the last day of the month, just once a month, as it relates to the 10 month sma, and take action (or not) accordingly. The following chart will illustrate the effectiveness of this strategy and is current through the end of July, 2017:
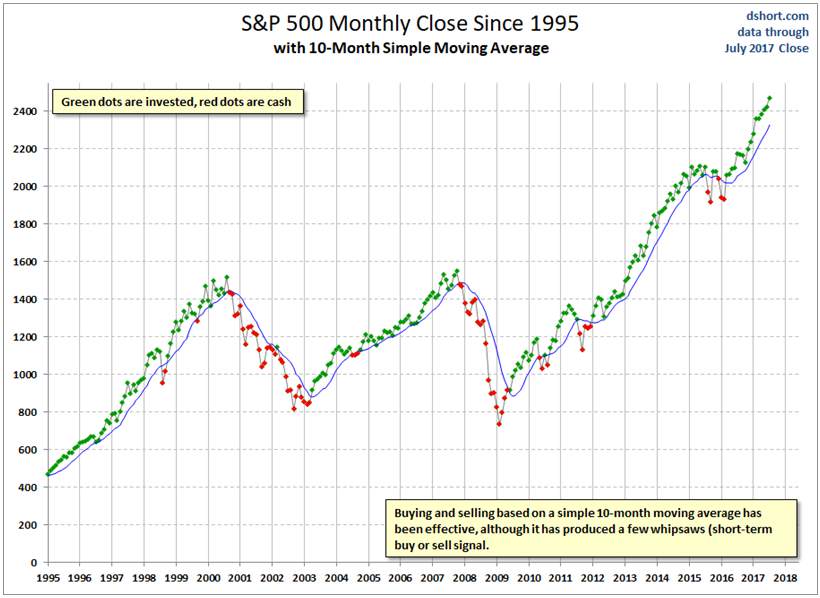
Just a casual glance at this chart should reveal the following:
1) Since 1995, over a 22 year period, this strategy has allowed for exposure to and participation in every major bullish uptrending market, sometimes for years
2) During that time period, this strategy has also enabled an avoidance of much of the major corrections that have occurred, keeping one away from much of the damage done to longer term investment accounts during major equity market declines
3) Whipsaws happen, as they do with any true trend following strategy, although there have been relatively few and the corresponding losses have been relatively minor, especially when compared to some of the very large winners
4) Price adheres pretty closely to the 10 month sma much of the time. When it gets too far away from the moving average in either direction, it will at some point return or revert back to the 10 month sma. Currently it seems to be getting too far away from the 10 sma to the upside
Just for fun, let’s dive a bit deeper and take a look at some of the numbers using the S&P 500 index itself non-leveraged, as follows and current through the end of July, 2017:
Entry date Entry price Exit date Exit price % gain (loss)
1/3/1995 459 9/1/1998 958 109%
11/2/1998 1099 10/1/1999 1283 17%
11/1/1999 1363 10/2/2000 1437 5%
4/1/2002 1147 5/1/2002 1077 (6%)
5/1/2003 917 8/2/2004 1102 20%
11/1/2004 1130 1/2/2008 1468 30%
7/1/2009 921 6/1/2010 1087 18%
8/2/2010 1108 9/1/2010 1050 (5%)
10/1/2010 1144 9/1/2011 1219 7%
2/1/2012 1312 9/1/2015 1970 50%
11/2/2015 2081 1/4/2016 2038 (2%)
4/1/2016 2057 7/31/2017 2470 20%
Applying this strategy and utilizing leveraged index etf’s as the trading vehicle only magnifies or compounds the results and does so in both directions. The relatively few and minor losses are more than made up for by the truly impressive gains in the successful positions. For example, if one were to have bought UPRO (3x leveraged etf for S&P500 index) at the market open on 4/1/2016 at 62.03 when the signal triggered on the SPX, this simple strategy would still have you in the position at approximately 110/share, approximately a 77% return (so far) over a 16 month holding period (so far). The entry on 2/1/2012 at 17.37/share would have been held for well over 3 years with an exit at the open on 9/1/15 at 53.13/share, a hypothetical return of 206%, more than tripling the original investment over a time frame of about 3 1/2 years requiring very little attention and absolutely taking no action except to buy and sell when the signals present the appropriate triggers and doing absolutely noting during the interim. (Note: notice how the positive returns of the leveraged etf are greater than would be expected from a simple multiple of the index itself)
Over the past 22 years, not every trade worked out as well as the above examples, but many of them did, some of them even better. While not a 100% perfect system (I don’t know of any that are), it’s possible this may be as close as one might reasonably expect
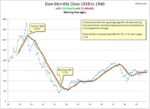
You might reasonably ask, well, how does it do during other periods in history when the central banks haven’t been as involved with the markets as they have been the past 10 – 15 years? It’s a reasonable question. So let’s take a look at how the monthly charts of the Dow look during the years of the Great Depression in the 1930’s and how this system may have performed then:
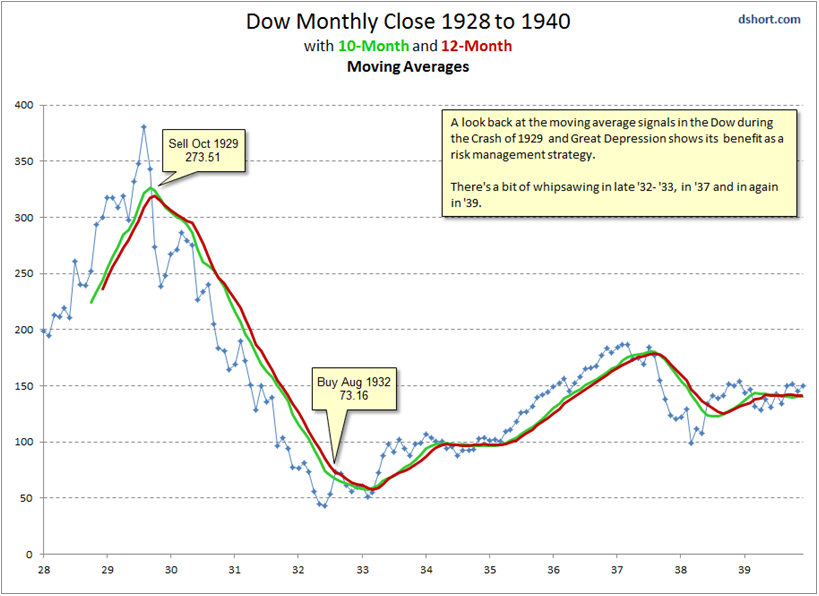 Even with just a casual glance one can see that this strategy (the green line is the 10 month sma) would have allowed an investor to avoid much of the carnage associated with the crash of 1929 and the substantial correction in 1937 while enjoying a good portion of the gains to be had during the rebound rallies that followed these periods of significant selling. There was a good bit of whipsaw that happened along the way, none of it apparently significant when compared to the possible gains to be had and the major losses to have been avoided.
Something to think about, at least for longer term investment accounts…..
Running List & Strongest Fundamental stocks on the IBD 50 for August 11h
Look for more earnings excitement next week as other leading growth stock report. Will the market continue to demonstrate a mixed behavior? we shall see!
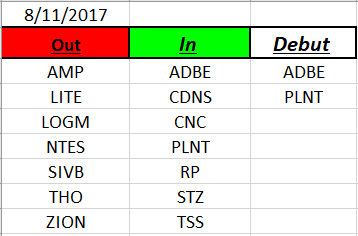
Running List: 164 growth stocks have appeared on the IBD 50 in 2017. Two stocks make their debut on the most resent list including: ADBE and PLNT . Here is the total In and Out list, download the full list here: Running List 8-11
Additionally, when the new IBD 50 list comes out twice per week I conduct a fundamental sort which results in the top fundamental IBD 50 stocks being identified. The top fundamental stocks for this week are: LRCX, ANET, BABA & NTRI. This sort is provided at: IBD 50 8-11 Sorted
Lastly, to sign up Free Webinars for this week:
How to Make Money Trading Stocks & ETFs Webinar August 18th: GO HERE