April 4, 2016
Good Day Traders,
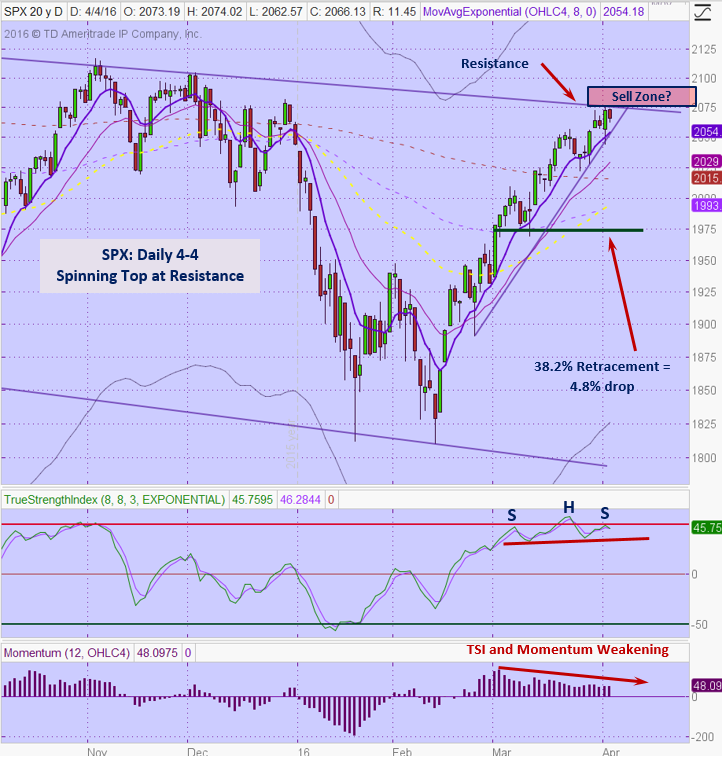
Market Update: Each of the three Tracking Indexes finished down today on below average volume. I don’t think we can make too much of the volume since most of the rise over the last couple of weeks has happened on below average volume. The bottom line on all three Indexes is that price action is a resistance with the S&P at the strongest resistance. While we could jump out and open downside position on the Indexes it would be prudent to wait and see if an attempted retest of the high takes place. We must respect how the Indexes have pulled back over since it rebounded around February 11th. To this point price action has respected the 8 day EMA so this is the current personality and we expect it to continue until it doesn’t. How will we know it may be failing? When price closes below both the 8 day EMA and the uptrend line shown on the S&P daily chart below. Each of the Indexes is putting in a similar pattern.
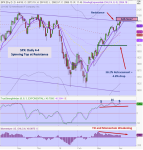
On the S&P the Head & Shoulder’s pattern shaping up on the TSI is looking like a failure pattern. When grouped with declining Momentum and price at stiff resistance a more significant pullback may be in order. This may work out as a process over several days up until mid-April when funding of 401Ks and IRA’s will conclude. If the current price action is pointing towards a downturn and action falls at the inverse angle to the ascent then a return to the bottom of the downtrend channel could take place by the week of June 16th at a level of 1773ish. This project could change if price action follows past action and drives sideways for several weeks. The last time price reached the top of the downtrend channel the fall off was not sudden, it took 8 weeks before the final break. At this point the price action has not repeated the price action of November 2015 and may not, but the clues are saying the path of least resistance at this point is at best sideways. Remember the price action from November 3rd of last year was stuck in a trading channel of 4.8% which provided several opportunities to trade both direction for the quick. A 4.8% retracement from Friday’s high would take price down to the 38.2% retracement level—very interesting! If volatility starts kicking up with wider daily swings this would add credence to a downside move.
NDX Bearish Harami reversal signal on daily chart. Bearish Engulfing reversal pattern on the RUT. Looking for bottoming pattern on Inverse ETF’s SQQQ and TZA.
SPX: Downside Market Short the SPY, SPY Puts or SPXU.
Preferred Long ETF’s: SPY, UPRO and SPXL
NDX: Downside Market Short the QQQ, QQQ Puts or SQQQ.
Preferred Long ETF’s: QQQ and TQQQ
RUT: Downside Market Short the IWM, IWM Puts or TZA.
Preferred Long ETF’s: IWM and TNA