
Good Day Traders,
Overview & Highlights: Over the past two Wednesday’s we have covered the modification that have been made to Strategy I of the system. A stable of leveraged ETFs has been selected. These leveraged ETFs have a great return potential for those willing to be patient and wait for the proper buy signals. I will still analyze growth stocks each weekend with the intent of finding 1-4 stocks each week, but will fall back to the leveraged ETFs for the mainstay of Strategy I opportunities. The primary reason for this adjustment is that it will simplify the weekly searches and put us in a position to focus on a smaller size watch list very closely every day.
Additionally, tonight another great article from Mike Trager covering Presidential Cycles 2.0.
Upcoming Webinars: At Active Trend Trading we offer two webinars per week to provide training plus trade and market updates. See the schedule below for the next webinars.
The How to Make Money Trading Stock Show—Free Webinar every Friday at 8:00 a.m. PDT. This weekly live and recorded webinar helped traders find great stocks and ETF’s to trade with excellent timing and helped them stay out of the market during times of weakness.
How to Make Money Trading Stocks on Friday, Nov 25th
Register now for the next live webinar at the link below:
Register Here: https://attendee.gotowebinar.com/register/5165055206338825729
Black Friday Special Time 8:00 a.m. PDT
Next Training Webinar: Nov 23rd
For Premium Members, our Wednesday evening training is developing some fantastic traders!
Topic: How to Find Strong Growth Stocks in less than 30 Minutes per Week
Mike’s Macro Market Musings: Election Cycles 2.0
The following is copied and pasted verbatim from another source with no commentary or explanation on my part since I believe none is necessary. Some of the information has been previously presented in a recent column, some of it has not. Keep in mind as you read through this that nothing is perfectly 100% predictive and that the charts presented herein are an average or composite of historical performance over 21 presidential elections encompassing 84 years of market data and that the market does not and will not adhere perfectly to these graphics in any given presidential election cycle. That being said, I present to you the following:
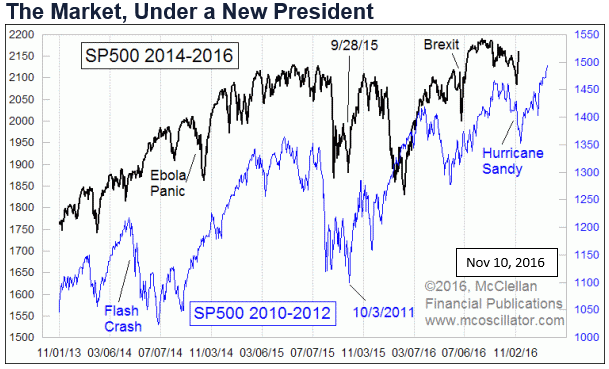
Investors get fearful ahead of a big election, because the outcome is unknown. Unknown risks are what investors fear most. Now that the result is decided, we have known risks to deal with. Investors were also fearful ahead of the 2012 election, which also had a surprising (for some) result. Recall that Gov. Romney had been up by 1-4% in the last polls leading up to that election. Polling that year was admittedly disrupted by the arrival of Hurricane Sandy, which also shut down the stock market for 2 days.
And interestingly, the market now is doing a pretty good imitation of the path of price movements 4 years ago. In 2012 there was a dip into mid-November after the Nov. 6 election. This time it was a dip the week before the Nov. 8 election. But in each case, there has also been a strong rebound after that dip.
You may have heard before that having a Democrat president is better for the stock market than having a Republican president, and there are statistics which can be used to support that. In the following chart, the averages for each category since 1933 are plotted:
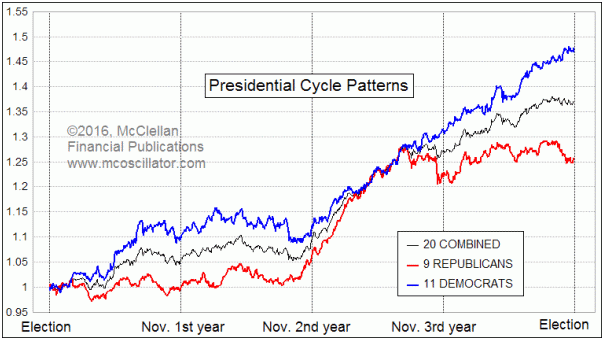
The real truth is a lot more nuanced than just saying one is better than the other. On average, the market has performed better for the first 16 months of Democrats’ terms, but then by the 3rd year that advantage completely disappears. And market performance in the 4th year is worse on average under a Republican president. A big part of that is the weakness after the Oct. 1987 crash, and from the 2008 bear market, both of which happened under Republican presidents.
Another differentiation among presidents concerns whether there is a new president from a different party, versus a 2nd term president or a new one from the same party. This one is a much bigger deal, especially during the first year of a new presidential term.
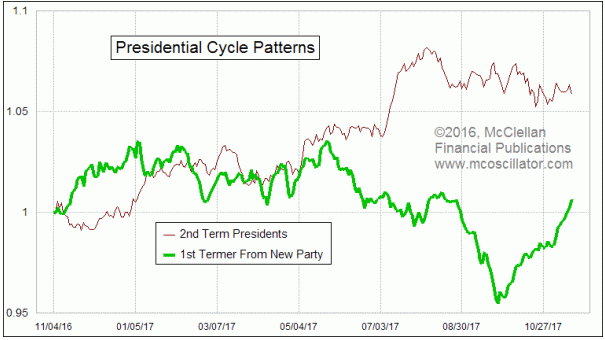
Generally speaking, investors respond more favorably at first to getting a new president from a different party. This has to do with celebrating that they got the change they wanted (or so they think). That positive emotion tends to wear off right around inauguration day, when they realize that the new president has not fixed all of the problems already.
The negativity under a new president persists as the year runs on, because of a habit they all seem to have. I have seen this same behavior repeatedly over my lifetime. A new president comes in, and spends his first year “discovering” that conditions are even worse than we were told during the campaign, and then tells us that “the only solution” is whatever package of tax hikes/cuts or spending adjustments he wants to make.
Bill Clinton did this in 1993. Despite 5% GDP growth then, Clinton asserted that “This is the worst recession in 50 years,” and he wanted to jam through a $20 billion package of pork barrel spending (mostly to reward campaign contributors). Congress wisely said no. When I think back on that, I realize that $20 billion is such a cute little number compared to the size of the “fixes” that have come since then.
With Bush 43 in 2001, it was tax cuts, although he could not get all he wanted right away and had to do another round in 2003. With Barack Obama in 2009, it was the American Recovery and Reinvestment Act, with $831 billion in stimulus spending (see why $20 billion is a cute little number)? They all seem to do it.
Investors generally don’t like hearing that things are worse than previously believed, and that creates a depressing effect on stock prices during a first year. Generally speaking, 2nd term presidents do not spend very much time blaming the immediate predecessor, or finding things wrong, and so investors don’t get frightened away as much. But as noted previously, that difference in stock market performance between 1st and 2nd term presidents generally goes away by the end of the 2nd year.
Every instance is different, and these charts just show what the average behavior has been.
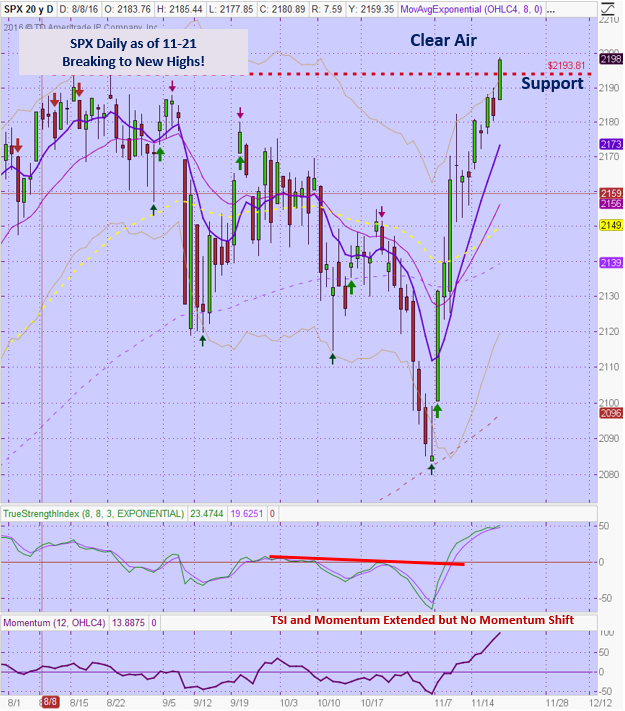
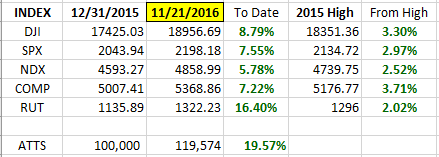
General Market Observation: Conventional wisdom said the market was going to dive after the election, but the Trump rally continues. Each of the three Tracking Indexes added to gains which started the day after the election. The RUT is the strongest of the three indexes followed by the SPX and NDX. Today’s breakout to new highs by the SPX could potentially lead the way for higher highs now that price action has reached clear airspace. It seems that a rest would be in order after the almost straight up move since November 9th, but there are no strong clues of when a pullback may take place.
Some clues worth watching. On daily charts the TSI has slowed but Momentum continues to push higher. Momentum is well past the 50 mark which usually works as a strong resistance level for the Indexes. This oscillator can rollover before price action stops going up but it will be indicative that the upward moving is losing vigor. Next, each thrust up on both the SPX and RUT increases the extension away from the mean of the moving averages. We know that at some point price action will do one of two things. Slow down and let the moving averages catch up or pullback to the moving averages. Neither of these have happen at this point. The NDX is the only member of the Tracking Indexes that has not pushed to a new high in this post-election rally. Will it be a drag on the rally or rush to catch up? Lastly, we know that rapidly ascending price moves are not sustainable over the long run, so watch for signs of exhaustion.
Remember this is a holiday week and holiday week’s normally have an upside bias. Often Black Friday retail reports will impact the week after Thanksgiving. Weak retail sales may provide a catalyst next week for at least a pullback. Add to this concern over the Fed meeting and report on December 14th and the current surge may come to a halt. Other than enthusiasm over a potentially more business friendly environment beginning after January, nothing has really changed with in the market’s internals.
SPX: Downside Market Short the SPY, SPY Puts or SPXU.
Preferred Long ETF’s: SPY, UPRO and SPXL
NDX: Downside Market Short the QQQ, QQQ Puts or SQQQ.
Preferred Long ETF’s: QQQ and TQQQ
RUT: Downside Market Short the IWM, IWM Puts or TZA.
Preferred Long ETF’s: IWM and TNA
The How to Make Money Trading Stock Show—Free Webinar every Friday at 8:00 a.m. PDT. This weekly live and recorded webinar helped traders find great stocks and ETF’s to trade with excellent timing and helped them stay out of the market during times of weakness.
How to Make Money Trading Stocks on Friday, Nov 25th
Register now for the next live webinar at the link below:
Register Here: https://attendee.gotowebinar.com/register/5165055206338825729
Black Friday Special Time 8:00 a.m. PDT
To get notifications of the newly recorded and posted How to Make Money Trading Stocks every week subscribe at the Market Tech Talk Channel: https://www.youtube.com/c/MarketTechTalk
– The Active Trend Trader Referral Affiliate Program is ready. For more information or to become an Affiliate please register here: https://activetrendtrading.com/affiliates-sign-up-and-login/
Index Returns YTD 2016
ATTS Returns for 2016 through Nov 21, 2016
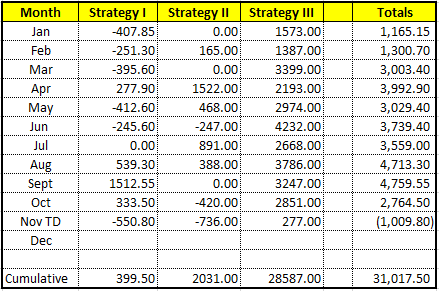
Percent invested initial $100K account: Strategies I & II invested at 0.00%; Strategy III invested at 20%.
Current Strategy Performance YTD (Closed Trades)
Strategy I: Up $399.50 or +0.57%
Strategy II: Up $2,031.00 or +20.3%
Strategy III: Up $28,587.00
Cumulative YTD: 31.02%
Active Trend Trading’s Yearly Objectives:
– Yearly Return of 40%
– 60% Winning Trades
– Early Warning Alert Target Yearly Return = 15% or better
For a complete view of specific trades closed visit the website at: https://activetrendtrading.com/current-positions/
Updated first full week of each month. The next update after first week in December
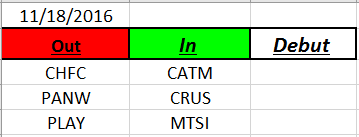
Outs & Ins: No new stocks debuted on the IBD 50 this weekend. Based on the weekend review there were no stocks providing a pullback entry. Most stocks are extended away from the moving averages so waiting for a pullback is appropriate. The strongest stocks from this weekend’s review include: NVDA, GIMO, HQY, LOGM, AEIS, UBNT, SIVB & VEEV. Others that were close include PRI, STL, THO, AMAT, CFG & WOR.
Stocks identified the week prior include AVGO and PANW. PANW was ripped after earnings today and looks to be down at support around $120. This shows the waters are still a bit choppy and unforgiving so caution is wise.
Share Your Success: Many of you have sent me notes regarding the success you are having with the Active Trend Trading System. Please send your stories to me at dww@activetrendtrading.com or leave a post on the website. Thanks.