
Good Day Traders,
Overview & Highlights: This past week the markets made an insane move after the initial BREXIT burp! Straight down followed by straight up with few clues if any the surge would be so powerful. Now we wait for what is next. Will resistance hold and July turn weak like it has about 7 out of the last 10 years? We shall see.
For Early Warning members Mike will share his partial entry trades if he takes a position based on the Standby Alert. As we’ve seen this year few entry triggers have been provided after the preliminary alert. There are nuances each year for the EWA strategy and this year this is the nuance which we will take action to trade with. Additionally, the short term courtesy alerts for the Inverse ETF’s will help add to the strength of this alert strategy.
Webinars: At Active Trend Trading we offer two webinars per week to provide training plus trade and market updates. See the schedule below for the next webinars.
How to Make Money Trading Stocks on Friday, July 8th
Register Here: https://attendee.gotowebinar.com/register/693096221970950404
New Time—11:00 a.m. PDT
Next Training Webinar: July 6th
For Premium Members our Wednesday evening training is developing some fantastic traders!
Mid-Week Market Sanity Check Topic: Selling Option Premium for Profit
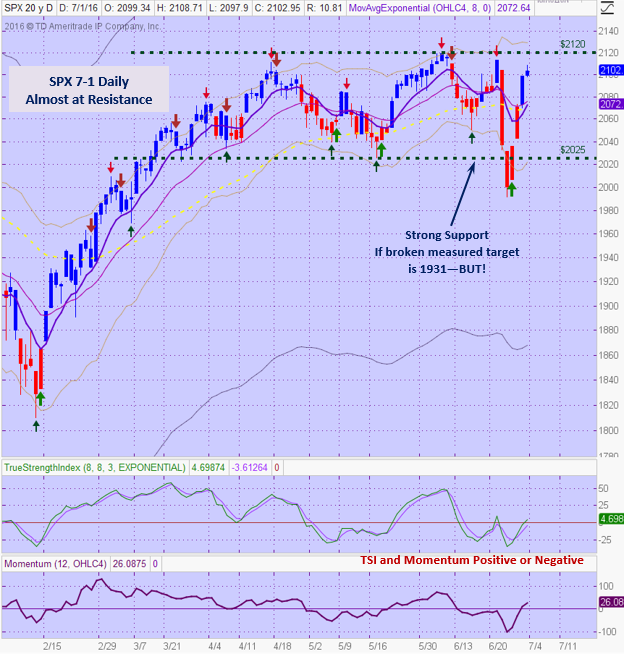
General Market Observation: A leftover thrust down on Monday in honor of BREXIT and then off to the races or at least back to resistance the rest of the week. What now? If we take a step back and observe price action on the SPX from mid-March through the end of June, the S&P Index has moved a lot and gone nowhere. Most of the price action has taken place between the 2025 and 2120 levels. From high to low in this trading range is about 4.8%. Since June 8th, the SPX has been in a short term downtrend showing lower highs and lows on the daily chart below. What should be our expectations for this week? Price action has reacted back up to the resistance zone between 2100 and 2120. If the range bound pattern continues to have an effect on prices then a pullback is in the offing. For those members who were on Wednesday’s training you can see how price is being contained within the Keltner Channel. When price approaches the top of the channel look for short-side trades in the Index ETF’s or upside trades in the Inverse Index ETF’s.
If prices did gap up towards the 2120 level it would be an appropriate point to nibble on a downside trade. In the current market environment, I would limit my position size to no more than ½ of a full position until Tracking Indexes settle on a longer term direction.
The current Indexes are very prone to move based on emotional reaction to news and economic reports. This week’s Job’s and Employment Situation reports hit on Thursday and Friday respectively. These are potential market moving reports. Also notice that over recent months the markets have tended to achieve their big moves between Wednesday and Friday. If this pattern continues it makes our analysis on Tuesday evening through the rest of the week most important. We are still in a tight stops and quick profits setting and will remain so until the Indexes settle on a firm direction.
Last week Gold rallied with the US Indexes. This is interesting action because typically these entities do not move in the same direction. This may bring credence to a flight to quality scenario for global investors. Gold and other precious metals are rallying on global weakness and the US Indexes are benefiting because the US markets are still perceived as a somewhat of a safe investment in a low interest environment.
The SPX and RUT appear to be the strongest of the three Tracking Indexes with the NDX being the weakest.
SPX: Downside Market Short the SPY, SPY Puts or SPXU.
Preferred Long ETF’s: SPY, UPRO and SPXL
NDX: Downside Market Short the QQQ, QQQ Puts or SQQQ.
Preferred Long ETF’s: QQQ and TQQQ
RUT: Downside Market Short the IWM, IWM Puts or TZA.
Preferred Long ETF’s: IWM and TNA
The How to Make Money Trading Stock Show—Note time change. This change will allow a full hour after the webinar to adjust trades. Free Webinar every Friday at 11:00 a.m. PDT. I’m looking for the best time to offer this webinar. I want to try closer to the close on Friday to see how that works out for potential trades going into the close. This weekly live and recorded webinar helped traders find great stocks and ETF’s to trade with excellent timing and helped them stay out of the market during times of weakness.
How to Make Money Trading Stocks on Friday, July 8th
Register Here: https://attendee.gotowebinar.com/register/693096221970950404
New Time—11:00 a.m. PDT
To get notifications of the newly recorded and posted How to Make Money Trading Stocks every week subscribe at the Market Tech Talk Channel: https://www.youtube.com/c/MarketTechTalk
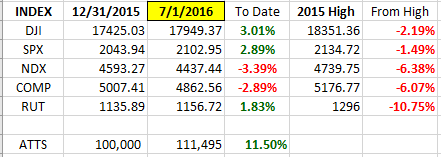
Index Returns YTD 2016
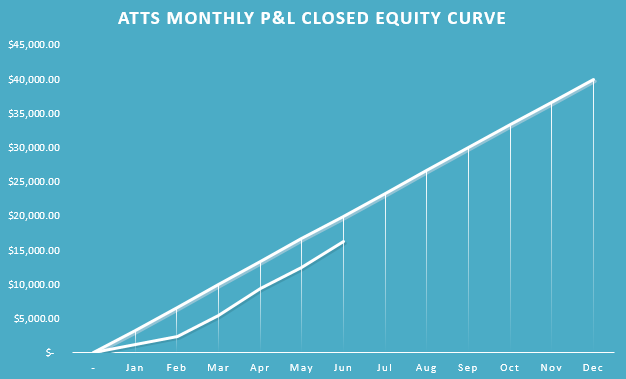
ATTS Returns for 2016 through June 24, 2016

Percent invested initial $100K account: Strategies I & II invested at 7.7%; Strategy III invested at 25.98%.
Current Strategy Performance YTD (Closed Trades)
Strategy I: Down -1435.05 or -2.05%
Strategy II: Up $2391.00 or +23.91%
Strategy III: Up $15758 or +60.77%
Cumulative YTD: 16.7%
Active Trend Trading’s Yearly Objectives:
– Yearly Return of 40%
– 60% Winning Trades
– Early Warning Alert Target Yearly Return = 15% or better
For a complete view of specific trades closed visit the website at: https://activetrendtrading.com/current-positions/
Updated first full week of each month. The next update July.
For our all Active Trend Trading Members here’s how we utilize our trading capital
Trading Capital Setup and Position Sizing: Every year we start the year off trading a $100K margin account split up into the three strategies used with the Active Trend Trading System.
– Each trader must define their own trading capital in order to properly size trade positions to meet their own risk tolerance level!
– Strategy I: Capital Growth—70% of capital which equates to $140K at full margin. This strategy trades IBD Quality Growth Stocks and Index ETFs. Growth Target 40% per year.
– Strategy II: Short Term Income or Cash Flow—10% of capital or $10K. This strategy focuses on trading options on stocks and ETF’s identified in Strategy I. The $10K will be divided into $2K units per trade.
– Strategy III: Combination of Growth and Income—20% of capital or $20K. This strategy will use LEAPS options as a foundation to sell weekly option positions with the intent of covering cost of long LEAPS plus growth and income.
– The $70K Strategy I portion of the trade account is split between up to 4 stocks and potentially a leveraged Index ETF. Actual number of shares will vary of course depending on price of the entity traded and amount of margin available. We have found that limiting open positions to only 5 entities greatly reduces the trade management time requirements for members.
– Naked Puts or short term options strategies will be used occasionally for Income Generating Positions
– None of the trade setups are recommendations to trade only notification of planned trades from set ups using the Active Trend Trading System. Each trader is responsible for establishing their own appropriate risk level if they decide to parallel trade.
The Active Trend Trading System objective is to provide a clear and simple system designed for members who work full time.
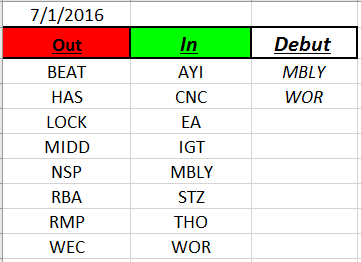
Outs & Ins: MBLY and WOR make their 2016 debut on the IBD 50 list. MBLY has just recently gone back into an uptrend so look for pullbacks to the 8/20/50 day moving averages for potential entries. AMBA often moves in concert with MBLY and appears to be finishing a bottoming pattern. WOR is approaching overhead resistance at past highs. It is not in a buying position and needs to pullback for a potential entry. Volume on WOR shows buying around earnings.
The Running List is up to 201 stocks that have appeared on the IBD 50 year to date. Many stocks on both list have followed the Indexes’ quick move up and are in need of pullback prior to long trades. In case the Indexes do rollover EW, WBMD and UBNT look like good downside candidates. VNTV and WOR are potential upside candidates after pullback bounce triggers.
Share Your Success: Many of you have sent me notes regarding the success you are having with the Active Trend Trading System. Please send your stories to me at mailto:dww@activetrendtrading.comor leave a post on the website. Thanks.