
Good Day Traders,
Overview & Highlights: Great article for Mike’s Macro Market Musing today. He looks at Market History compared to today’s action—we know what to expect, just not when! While we are waiting learning how to be a swing and trend trader will help us stay ahead of a market moving sideways!
Our seven focus ETFs continue to perform well this year. We know each of these leveraged ETFs are going to provide several large potential moves during the year. Our job—wait for the triggers! Focusing on limited proven performers is part of the Mechanics of Consistency! We’ll cover this topic in this week’s Mid-Week Training session.
Upcoming Webinars: At Active Trend Trading we offer four webinars per week to provide training plus trade and market updates. See the schedule below for the next webinars.
After Market Monday’s—Free Fast Paced Webinar every Monday after the Market closes at 1:10 p.m. PDT. Invitations are posted weekly at: https://www.facebook.com/ActiveTrendTrading/
How to Make Money Trading Stock Webinar—Free Webinar every Friday at 11:00 a.m. Pacific Time. This weekly live and recorded webinar helped traders find great stocks and ETF’s to trade with excellent timing and helped them stay out of the market during times of weakness.
How to Make Money Trading Stocks on Friday, May 26th
Register now for the next live webinar at the link below:
Register Here: https://attendee.gotowebinar.com/register/6325756859240737794
Time 11:00 a.m. PDT
Next Training Webinar: May 24th
For Premium Members, our Wednesday evening training is developing some fantastic traders
Topic: How to Achieve Trading Consistency
** Friday’s “Final Hour” **
Time 12:00 p.m. PDT
For Premium Members, provides trades and set ups during the final hour of weekly trading.
Managing Current Trades: Positions open in Strategies I, II & III
Strategy I: One position Open
UCO: Opened at 15.69 on 5/8/17; Closed ½ position on 5/12 for 5.16% gain or Profit = $162.00
NUGT: Opened at 29.21 on 5/8/17; closed last part of position on 5/15. Total Profit = $616.50
Mike’s Macro Market Musings: Title/topic: Equity Valuations and Market Forecasts Revisited
I have written before of the current extremes in U.S. equity valuations and the historical precedents for the relatively poor long term performance of a passive buy and hold investing strategy in longer term accounts going forward from such extremes. Keeping in mind, however, that valuations are not, and have never been meant to be, of any use as timing indicators. While I have virtually no insight as to what the market might do during the coming days, weeks, or even months, what it might do over the next 8 – 12 years is fairly predictable. And the answer is that the overall U.S. equity markets will likely turn in a very sub-par performance over that time frame with a significant correction (and subsequent bounce) along the way, evidence for which is presented herein.
Much of the following is copied and pasted from elsewhere with very little, if any, commentary from me, since much of it speaks for itself. For those interested in further reading on this topic, the full article is really informative, interesting, and an engaging read. Here’s the link: http://www.mauldineconomics.com/frontlinethoughts/stock-market-valuations-and-hamburgers2.
“To refer to a personal taste of mine, I’m going to buy hamburgers the rest of my life. When hamburgers go down in price, we sing the ‘Hallelujah Chorus’ in the Buffett household. When hamburgers go up in price, we weep. For most people, it’s the same with everything in life they will be buying except stocks. When stocks go down and you can get more for your money, people don’t like them anymore.”
– Warren Buffett, Fortune magazine
Following are a number of our favorite valuation metrics. Let’s take a look at them and see what the research data tell us about probable forward returns (high-priced or low-priced hamburgers):
Median P/E can help us predict what future 10-year annualized returns are likely to be for the S&P 500 Index. Will your future burgers be pricey or cheap? The price at which you initially buy matters.
Here is how you read the following chart. (Data is from 1926 through 2014.):
- Median P/E is broken down into quintiles. Ned Davis Research looked at every month-end median P/E and ranked the numbers, with the lowest 20% going into quintile 1, the next 20% into quintile 2, and so on, with the most expensive or highest P/Es going into quintile 5.
- They then looked at forward 10-year returns by taking each month-end P/E and calculating the subsequent 10-year annualized S&P return.
- They sorted those returns into quintiles and determined that returns were greatest when initial P/Es where low and worse when P/Es were high.
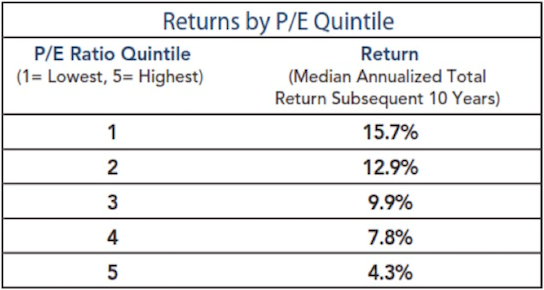 With a current median P/E for the S&P of 24, we find ourselves firmly in quintile 5. That tells us to expect low returns over the coming 10 years. Though it appears that most investors are expecting 10% from equities, history tells us that the market as a whole will have a hard time growing much faster than our country’s GDP does. Note that 4.3% returns are the average of what happens when stocks are purchased in the top 20% of valuations. That forward return number goes down considerably if we are in the top 10% or top 5%, which is where we are today. The reality today is that hamburgers are expensive.
What about Drawdowns?
The following chart is a look at the downside risk by valuation quintile.
When valuations are highest, not only are returns lowest but risk is highest. This chart shows that from where we are today we should expect an 18% drawdown in an average case and a worst-case -51% if there is a recession (more recession probabilities in a moment).
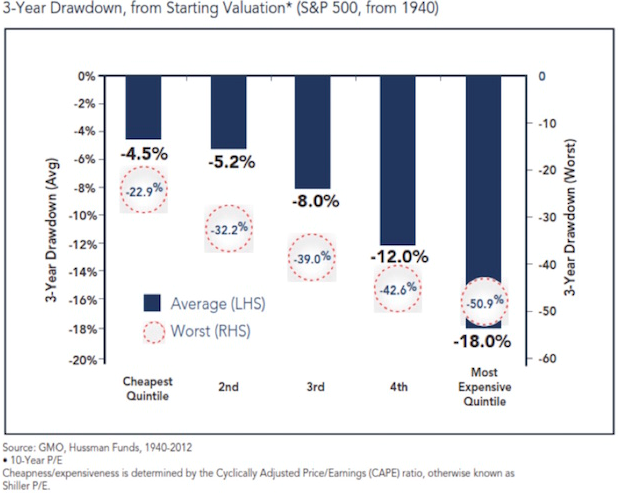
(Mike’s comment – the above chart shows that, since we are currently well into the most expensive quintile of CAPE ratios, history would indicate that sometime in the next three years it would be quite realistic to expect an average pullback in the S&P 500 of 18% and perhaps as much as 51%)
Household Equity Ownership Percentage vs. Subsequent Rolling 10-Year S&P 500 Index Total Returns
This next chart shows that household equity ownership percentage has a high correlation with future annualized returns.
Here’s how you read the chart:
- Think in terms of buying power. If individuals are fully invested in stocks, how much more money do they have available to buy more stocks? More buyers than sellers pushes prices higher. More sellers than buyers pushes prices lower.
- The blue line tracks the percentage of total household financial assets that are equity investments, including mutual funds and pensions.
- Take a look at the top red arrow. At the market top in March 2000, the high level of equity ownership was forecasting a return of -3% annualized over the coming 10 years.
- The black dotted line plots total return over the subsequent 10 years, on a rolling basis.
- Again, focus in on 2000. The dotted black line shows that total return over the following 10 years turned out to be approximately -1%.
- Look how closely the dotted black line tracks the blue line over time.
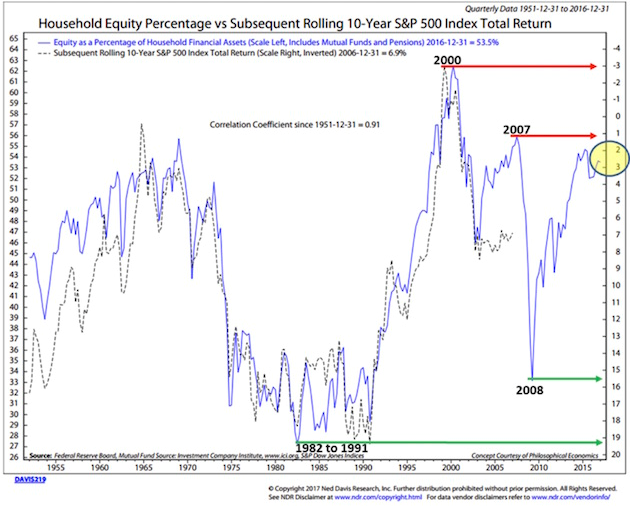 (Mike’s note – Again, history shows that when the percentage of household financial net worth is somewhere around 52 – 55% equities, 10 year forward returns of the S*P 500, total return including dividends (the dividend is currently approximately 2%) tend to be sub-par. As of 12/31/2016 this metric, which has a correlation of 91% with actual realized historical results, appears to be reading around 54%, implicating a forward 10-year average total annual S&P return, including dividends, of less than 3% from the SPX level of 12/31/2016. With a 2% dividend, this implies expectations of less than 1% average annual nominal price change in SPX, pretty much in line with implications of other metrics.)
Space here limits further discussion of this topic. For further insight and examples and use of other metrics, use the above link to read the full article. The bottom line to all of this is to not expect the next 8 or 10 years to look anything like the past 8 years in terms of equity index price appreciation, and be prepared for a substantial correction and bounce from that correction along the way.
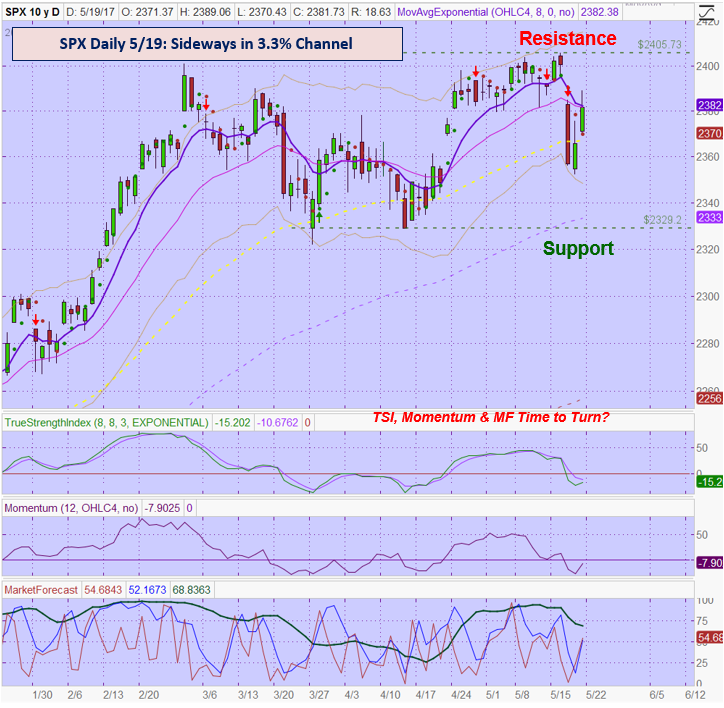
General Market Observation: What will be the path to profits this week? Are the Indexes on thin ice with all the “cooked” up trouble facing President Trump opposing the potential growth upside? Remember the Indexes have run hard during the first leg of the Trump Rally and continued digestion of these gains is not surprising. Each of the three Tracking Indexes reacted to Wednesday’s noise and participated in the selloff. However, the personality of bouncing quickly after downside pressure continues to present itself. If this remains the status quo selloffs will continue to be short and very shallow. This environment sets up well for Swing Trades between support and resistance and back. Longer term Trend trades for the Indexes are not on the dance card yet. Maybe the end of year rally will reignite the uptrend.
SPX: Patience for price action to move between support and resistance. Price action has been stuck between the 2329-2405 levels since early March. This is a 3.3% range so the leveraged ETFs for SPX would range between 9-10%. Wait for bounce.
NDX: Strongest of the Tracking Indexes. Be aware of the negative divergence on the weekly TSI and Momentum. Again, with the Summer Doldrums approaching the Nasdaq may also be setting up for a sideways move. Watch to see where support and resistance is established.
RUT: I like the potential of swing trading the RUT ETFs over the other Index ETFs. This is because price action has been constrained in a 4%-5% lateral price range since early December 2016. Place support alerts at 1355 and resistance alerts at the 1400 level. Traders can trade TNA and TZA at support and resistance respectively.
SPX: Downside Market Short the SPY, SPY Puts or SPXU.
Preferred Long ETF’s: SPY, UPRO and SPXL
NDX: Downside Market Short the QQQ, QQQ Puts or SQQQ.
Preferred Long ETF’s: QQQ and TQQQ
RUT: Downside Market Short the IWM, IWM Puts or TZA.
Preferred Long ETF’s: IWM and TNA
How to Make Money Trading Stock Webinar—Free Webinar every Friday at 11:00 a.m. PDT. This weekly live and recorded webinar helped traders find great stocks and ETF’s to trade with excellent timing and helped them stay out of the market during times of weakness.
How to Make Money Trading Stocks on Friday, May 26th
Register now for the next live webinar at the link below:
Register Here: https://attendee.gotowebinar.com/register/6325756859240737794
Time 11:00 a.m. PDT
To get notifications of the newly recorded and posted How to Make Money Trading Stocks every week subscribe at the Market Tech Talk Channel: https://www.youtube.com/c/MarketTechTalk
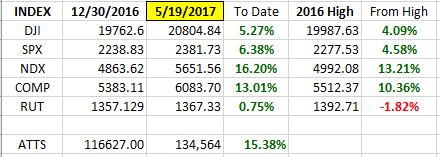
Index Returns 2017 YTD
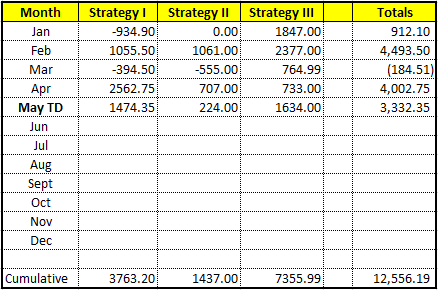
ATTS Returns for 2017 YTD Closed Trades
Percent invested initial $116.6K account: Strategies I & II invested at 3%; Strategy III invested at 17%.
Current Strategy Performance YTD (Closed Trades)
Strategy I: Up $3763.20
Strategy II: Up $1437.00
Strategy III: Up $7355.99
Cumulative YTD Closed: 10.77%
Cumulative YTD Closed & Opened: 15.38%
Active Trend Trading’s Yearly Objectives:
- Yearly Return of 40%
- 60% Winning Trades
- Early Warning Alert Target Yearly Return = 15% or better
For a complete view of specific trades closed visit the website at: https://activetrendtrading.com/current-positions/
Updated first full week of each month. The next update after first week in June.
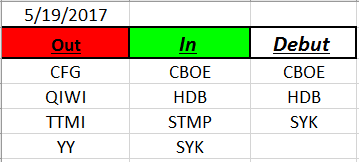
Outs & Ins: CBOE, HDB & SYK make their debut on the IBD 50 this weekend.
Fundamentally Strongest IBD 50 stocks: COHR, MELI, LRCX, NVDA and AMAT.
 Share Your Success: Many of you have sent me notes regarding the success you are having with the Active Trend Trading System. Please send your stories to me at dww@activetrendtrading.com or leave a post on the website. Thanks.