
Only for the Month of May: 1 Month Trial Membership details HERE or
go to this link: https://activetrendtrading.com/atts-trial/
Good Day Traders,
Overview & Highlights: Some great items to highlight in this weekend’s edition. First Mike’s Macro Market Musings is spot on with an analysis between how companies are on a slippery slope regarding how they report earnings. It seems that some economist are waking up and sounding the alarm that what they are seeing certainly looks a lot like 2000 and 2007. Mike and I have been sounding that bell for a while. Not because we are perma-Bears but because our studies take us into analyzing the internals and the internals stink right now! If you were around for the clamor of the 2000 top you remember the cry, “It’s different this time!” Those same 4 words are being repeated now—do you trust them?
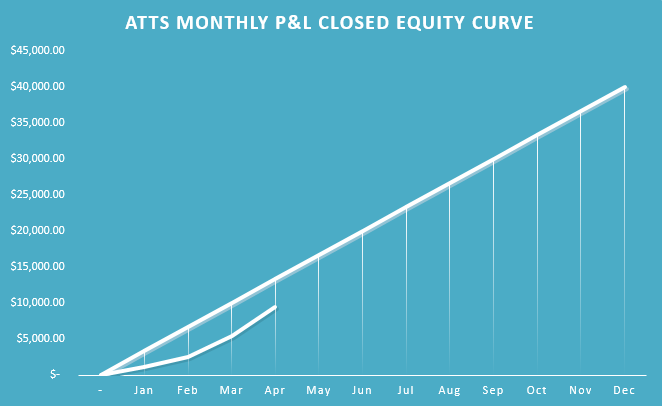
Secondly, I’m very pleased with Active Trend Trading equity chart through April. It is sitting at positive 9.4% with an acceleration in profits for the first 4 months of 2016. If we maintain the current pace on average the Active Trend Trading System for 2016 will finish up close to 30%. My goal for the remaining 8 months is to continue the monthly acceleration and finish closer to our target 40% or higher for the year.
Webinars: At Active Trend Trading we offer two webinars per week to provide training plus trade and market updates. See the schedule below for the next webinars.
How to Make Money Trading Stocks on Friday, May 7th
Register Here: https://attendee.gotowebinar.com/register/6141163142038537218
Note this session will be at: 11:30 a.m. PDT
Next Training Webinar: May 4th
For Premium Members our Wednesday evening training is developing some fantastic traders!
Mid-Week Market Sanity Check Topic: Intraday Charts for After Hour Analysis
Mike’s Macro Market Musings—Topic: Random Market Observations
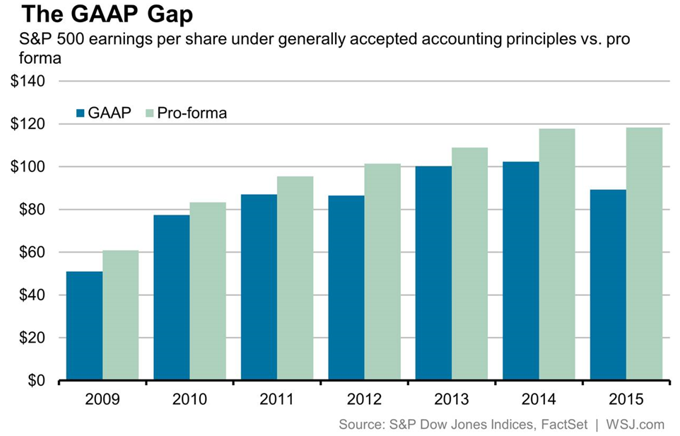
In prior postings I have made a point of the growing discrepancies in the quarterly earnings reports between GAAP and non-GAAP results and the increasing tendency of companies to use non-GAAP numbers to paint a more rosy picture of their financial performance than would otherwise be evident. The current GAAP gap for the S&P 500 earnings overall, a ratio of approximately .75 for GAAP vs. non-GAAP reported earnings, is as wide as it has ever been at prior market tops in 2000 and 2007 as evidenced in the graphics below:
Well, now it seems that no less than the chairwoman of the SEC, Mary Jo White, has been reading this column! In just the past few days there have been reports in the financial media that the SEC is becoming increasingly concerned about the GAAP gap and the undisciplined use of non-GAAP metrics, especially among publicly traded technology companies. As evidenced in a recent speech to the U.S. Chamber of Commerce, Ms. White has warned of the imminent possibility of the SEC clamping down on the egregious use of non-GAAP financial reporting via the issuance of guidelines and regulations to bring more order, uniformity, consistency, and transparency to non-GAAP financial reports, along with the implicit threat of punishment for companies that don’t adhere to whatever new regulations may be forthcoming.
As IBD notes in a recent article addressing this issue, there was a similar controversy and fierce debates about the use of non-GAAP metrics at the height of the dot com boom in 1999-2000 during the super-heated final quarters of that equity bubble. For those who insist on claiming that things are different this time, isn’t the timing of this controversy interesting? And isn’t it interesting that if history doesn’t always repeat itself, it often rhymes? Glad to see that the authorities who are supposedly regulating our financial markets are at least beginning to pay lip service to one obvious current distortion in our equity markets. It remains to be seen if any real action will be forthcoming, especially in an election year.
Speaking of elections, I am certainly no fan of Donald Trump and I find his current prominence in this election year to be both farcical and a sad commentary on our culture and society that has allowed and supported his rise to this position, albeit certainly a wakeup call for the political establishment to the dissatisfaction and even anger the populace feels at the current state of both domestic and international affairs in our nation. While I know that Mr. Trump is completely unaware of someone like me, he might be pleased to know that I do agree with him on one item, which is his assessment of Janet Yellen, current chairwoman of the Federal Reserve Board. I am even less of a supporter of her than I am of the Donald. In recent interviews Mr. Trump has expressed his general and vague disapproval of Ms. Yellen and has alluded to the likelihood that, if elected, he will either ask for her resignation or, at the very least, not reappoint her when that time comes. He does not go into specifics about who he might choose as her replacement, but not being specific about planned actions seems to part of his allure to his supporters. I, for one, will applaud his views on this particular topic even if I don’t do so on many others.
Is Apple the new Microsoft? This question has been raised in recent webinars by Dennis and I believe it is a very valid observation and topic for consideration. It wasn’t very long ago that the stock of Apple (AAPL) was the proverbial 800 pound gorilla that could move the markets almost by itself with a market cap that gave it undue influence on the popular equity indexes we commonly monitor. For now at least, those days seem to be over. The stock of Microsoft (MSFT) enjoyed similar prominence and influence in the 1990’s building up to the market peak at the height of the dot com craziness in 1999-2000. A review of the monthly charts for MSFT during that time shows a parabolic rise in price action that paralleled the Nasdaq during that time.
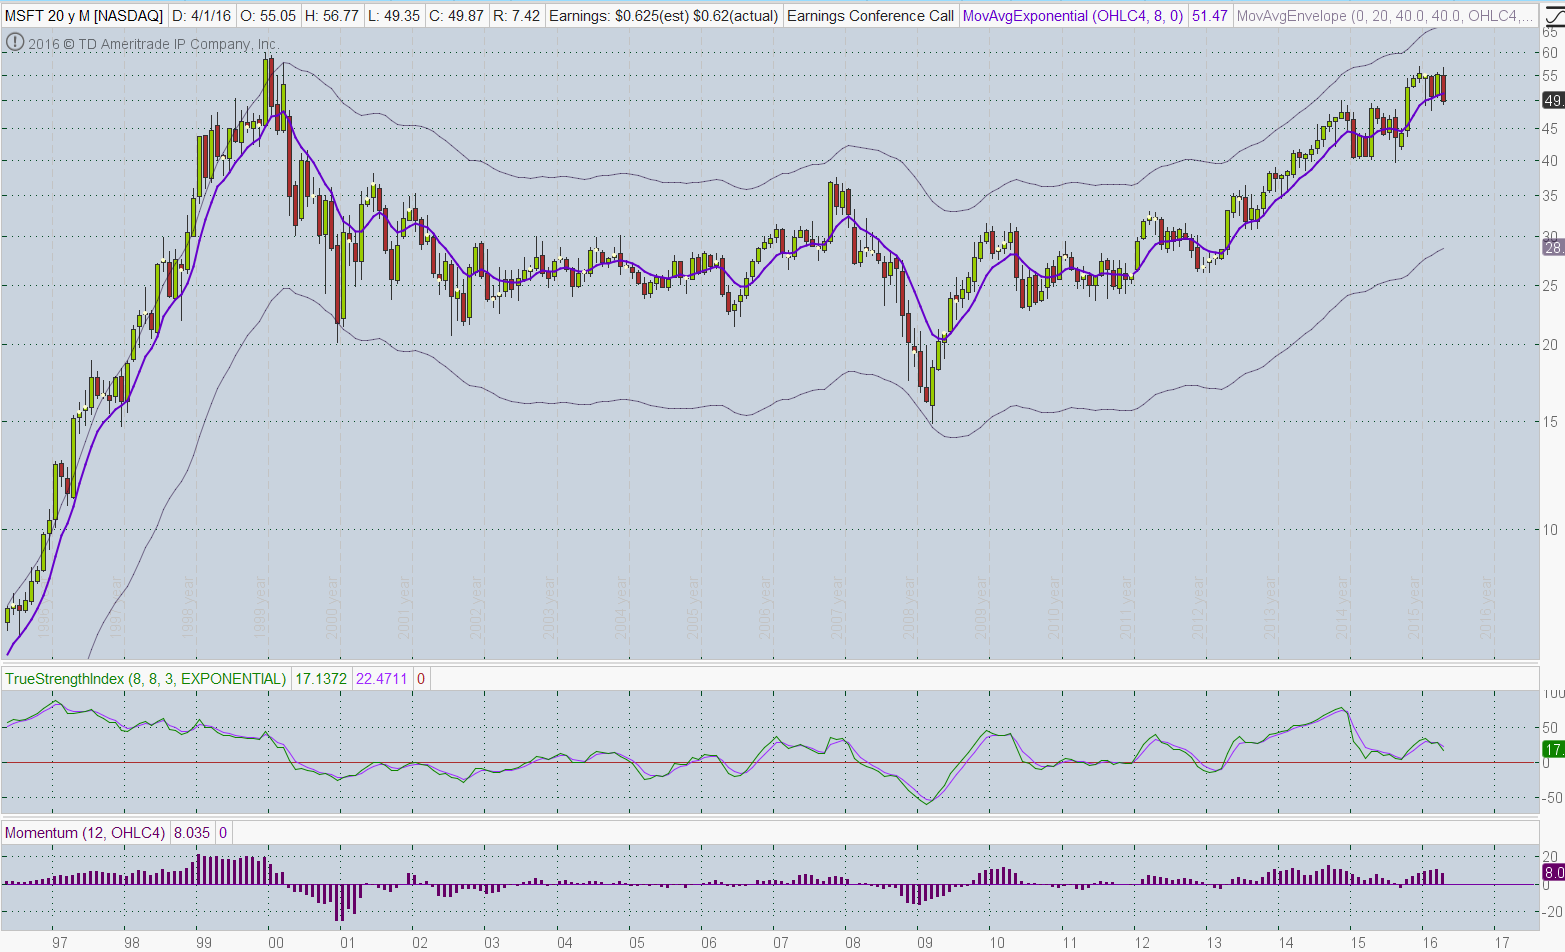
Needless to say, that kind of parabolic growth in market influence and price action is unsustainable. The stock of MSFT reached its all-time high price in December of 1999 and has not surpassed it since, only recently even beginning to approach that price level more than 16 years later. MSFT became so big it kind of collapsed under the weight of market expectations and has morphed into almost a utility stock that kind of quietly plods along and pays a dividend to its shareholders. Are we witnessing the transformation of the stock of AAPL along a similar path? It seems likely that we indeed are. The monthly chart of AAPL for the past several years exhibits the same kind of unsustainable parabolic price action as seen in the MSFT chart during the 1990’s.
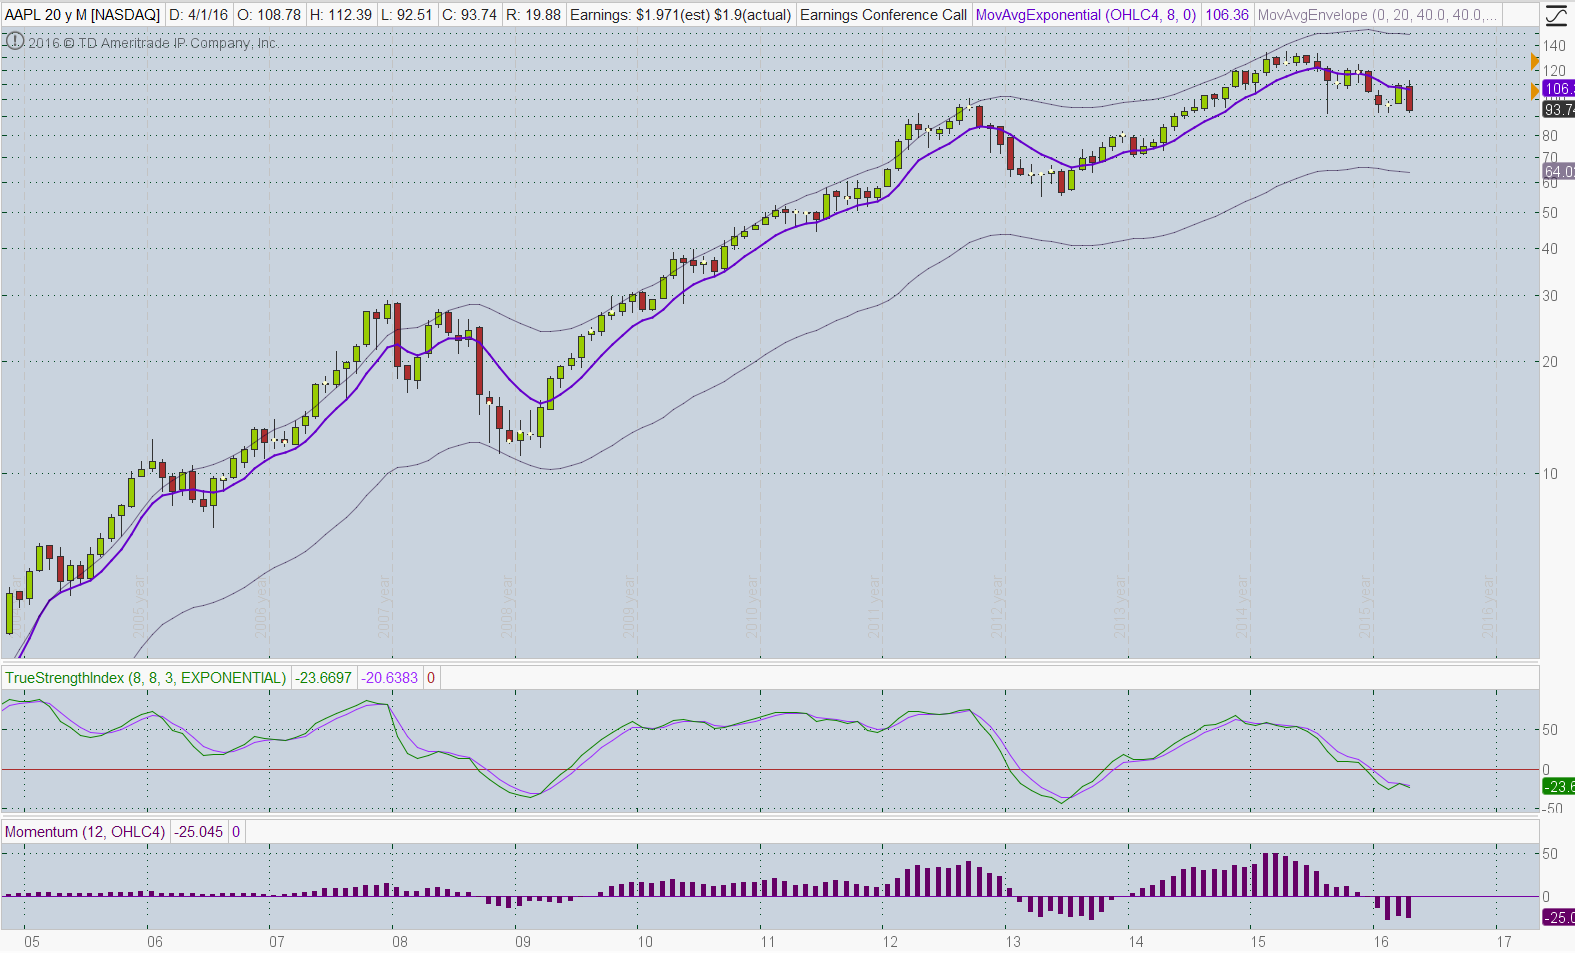
Price action in the equity indexes no longer moves tick by tick along with AAPL stock price action as it did relatively recently. Since it was added to the Dow Jones Industrial Average in March, 2015, the stock has fallen approximately 26%. Historically, a common observation is that stocks that join the Dow index have often passed their hyper growth and prime years (MSFT is also a Dow index stock). In a bid to appeal to investors attracted to value stocks as opposed to growth stock investors, AAPL is becoming more focused on returning cash to investors by increasing its dividend and share buyback program, thereby acknowledging that returns to shareholders won’t likely be primarily due to organic price appreciation anytime soon. I am not by any means trying to denigrate AAPL as a company, but it does seem as if the stock of AAPL may have seen its glory days and it might very well be in the process of becoming the new MSFT. Organizations like MSFT and AAPL that have enjoyed years of parabolic growth in industry and market influence, along with price action and market capitalization growth, inevitably peak at some point when the “law of large numbers” exerts its influence. Future market leadership will likely have to come from elsewhere. In the meantime, please excuse me, a text message just came in to my iPhone.
General Market Observation: Each of the three Tracking Indexes suffered selling last week with the Nasdaq 100 showing the greatest weakness. The chart below is a weekly chart of the NDX and it looks very weak! Price action over the past three weeks tested the downtrend channel line and failed to breakout. The weekly TSI has now crossed and Momentum is sloping down. Using symmetry with the last plunge at the end of 2015, prices could fall to the bottom of the downtrend channel. A price target between 3720 and 3690 comes into play around the week of June 27th. A similar analysis of the last fall in the TSI provides similar timing results for when we could expect prices to bottom. Now the Fed or one of the other Global Central banks could pull a rabbit out of the hat to slow or even negate the fall but for now I will be looking for downside entries with either Puts on QQQ or a long position in SQQQ. I want a pull-up into the daily moving averages and overhead resistance between the 4400 and 4421 levels. Great place for a price alert!
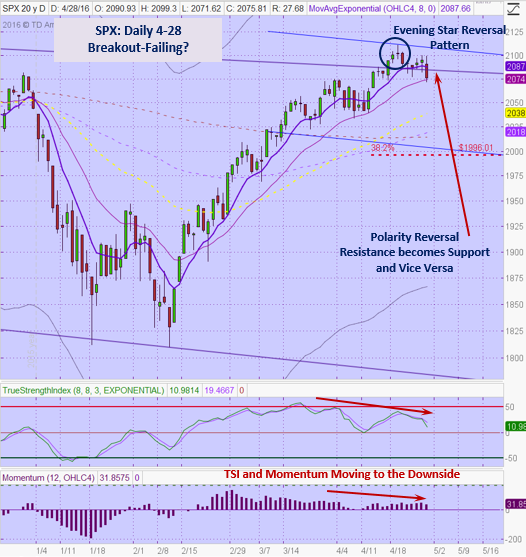
The SPX is also falling back into the downtrend channel. Price actin finished with a daily Hammer on Friday so look a potential pullup in to resistance between 2075 and 2082. I will target this zone for a potential downside trade. I like the leveraged inverse ETF SPXU when the SPX is at this level.
The RUT held up best last week but if the other two Indexes continue to unravel the small-caps should follow. The weekly chart shows a Bearish Dark Cloud reversal pattern. An Area of resistance at 1050 will serve as the line of demarcation for planning downside opportunities. Daily prices finished on top of the 20 and 200 day moving averages as a support zone.
SPX: Downside Market Short the SPY, SPY Puts or SPXU.
Preferred Long ETF’s: SPY, UPRO and SPXL
NDX: Downside Market Short the QQQ, QQQ Puts or SQQQ.
Preferred Long ETF’s: QQQ and TQQQ
RUT: Downside Market Short the IWM, IWM Puts or TZA.
Preferred Long ETF’s: IWM and TNA
The How to Make Money Trading Stock Show—Free Webinar every Friday at 11:30 a.m. PDT. I’m looking for the best time to offer this webinar. I want to try closer to the close on Friday to see how that works out for potential trades going into the close. This weekly live and recorded webinar helped traders find great stocks and ETF’s to trade with excellent timing and helped them stay out of the market during times of weakness.
How to Make Money Trading Stocks on Friday, May 7th
Register Here: https://attendee.gotowebinar.com/register/6141163142038537218
Note this session will be at: 11:30 a.m. PDT
To get notifications of the newly recorded and posted How to Make Money Trading Stocks every week subscribe at the Market Tech Talk Channel: https://www.youtube.com/channel/UCLK-GdCSCGTo5IN2hvuDP0w
– The Active Trend Trader Referral Affiliate Program is ready. For more information or to become an Affiliate please register here: https://activetrendtrading.com/affiliates-sign-up-and-login/
Index Returns YTD 2016
I’ve added a column to the Index YTD performance chart. The column on the far right shows the depth of the current correction with respect to the highs of the top from 2015. Note both DJI & SPX are now in positive territory for 2016.

ATTS Returns for 2016 through April 29, 2016
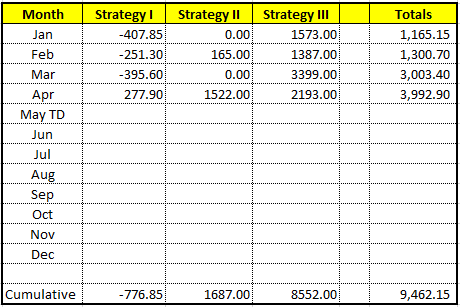
Percent invested $100K account: Strategies I & II invested at 7%; Strategy III invested at 20%.
Current Strategy Performance YTD (Closed Trades)
Strategy I: Down -776.85 or -0.78%
Strategy II: Up $1687 or 16.87%
Strategy III: Up $8552 or +42.7%
Cumulative YTD: 9.46%
Active Trend Trading’s Yearly Objectives:
– Yearly Return of 40%
– 60% Winning Trades
– Early Warning Alert Target Yearly Return = 15% or better
For a complete view of specific trades closed visit the website at: https://activetrendtrading.com/current-positions/
Updated first full week of each month.
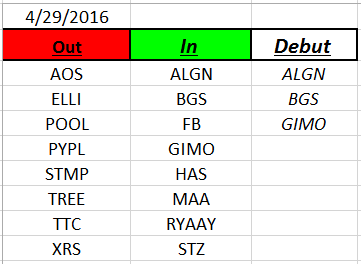
Outs & Ins: ALGN, BGS and GIMO make their debuts on the IBD 50 list this weekend. ALGN reported earnings last week and finished the week with the biggest daily candle since February. This may market ALGN as a potential downside candidate instead of an upside candidate. BGS finished the week with a huge upside move after earnings and closed at resistance of a expanding bearish triangle. GIMO moved higher with earnings but shows similar characteristics of other stocks that gapped higher with earnings and then spent the rest of the day selling off. AMZN demonstrated a similar pattern which is not a sign of a strong market.
With the Indexes looking weak I’m not in a hurry to jump into long positions unless they are bouncing after a healthy pullback. The best looking pre-earnings candidates are OLED and LGIH.
Share Your Success: Many of you have sent me notes regarding the success you are having with the Active Trend Trading System. Please send your stories to me at dww@activetrendtrading.com or leave a post on the website. Thanks.