
Good Day Traders,
Overview & Highlights: Only a week to go until the end of September. September is known as a historically weak month and this year’s edition has shown no abnormal strength. With the Fed standing aside until closer to the election what’s in store? I’m sensing we could see an early rally going into the 4th quarter and then a potential sell-off after the election is over regardless who wins. If the Fed senses there is a greenlight to raise rates at the end of the year, December may finish with a plop! Of course this is speculation at this point and we must trade the charts in front of us!
We exited our Early Warning Alert trade when a trailing stop was hit. Profit YTD on the EWAS is 12%.
Webinars: At Active Trend Trading we offer two webinars per week to provide training plus trade and market updates. See the schedule below for the next webinars.
How to Make Money Trading Stocks on Friday, Sept 30th
Register now for the next live webinar at the link below:
Register Here: https://attendee.gotowebinar.com/register/2727166400059649
11:00 a.m. PDT
Next Training Webinar: Sept 28th
For Premium Members our Wednesday evening training is developing some fantastic traders!
Topic: How to find Rock Solid Support and Resistance—Part 2
General Market Observation: My big question going into the final week of September is how will the 3 Tracking Indexes shape up for an end-of-year rally? Each Index responded well to the Fed’s decision to leave interest rates unchanged this may leave 6 weeks of positive trading opportunities before the next meeting. A second question is how will the Presidential Debates and actual election drive expectations for the positive or the negative? As I said in the opening comments, let the charts tell us what to do.
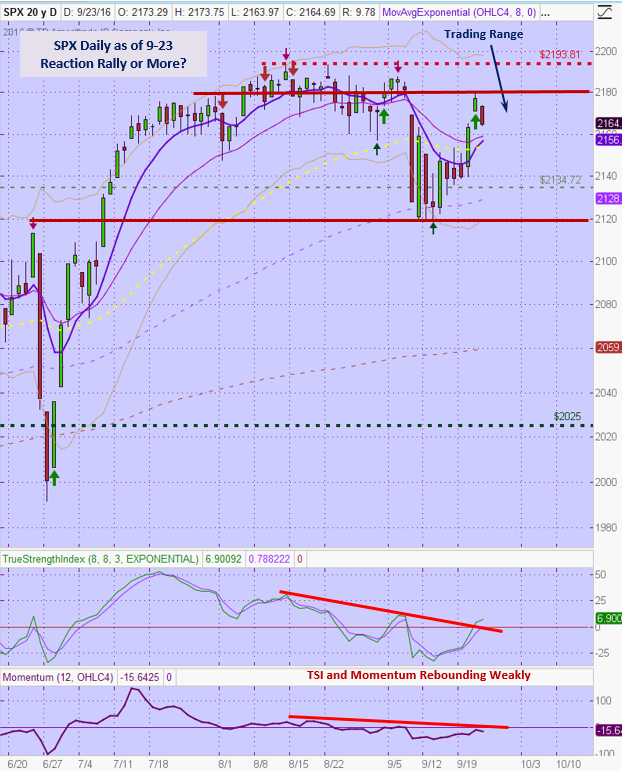
The SPX had the weakest reaction to the Fed’s decision. As we can see in the chart below prices did push up into a past resistance zone and then sold off on Friday. If this is simply pullback to the moving average cluster, then we need to be ready to trade this Index or it’s surrogates at that point. A Fib retracement of the move up over the past week places a 38.2% retracement at the moving average cluster. This is a point to pay attention and be ready for a bounce to at least retest the resistance zone. Momentum needs to kick in at some point and move back above the zero line for the highs at 2193 to be broken!
The NDX provided the strongest move since the bounce on 9/12. It has broken to new highs and could pull back into support at the breakout level of 4840. This is the level where NDX would become interesting to the upside. The RUT also broke to new yearly highs but then reversed back below 1261 on Friday. For both of these indexes we can also use the moving average clusters to plan long side trades. On the RUT watch for a retracement between the 1227 and 1241 levels.
SPX: Downside Market Short the SPY, SPY Puts or SPXU.
Preferred Long ETF’s: SPY, UPRO and SPXL
NDX: Downside Market Short the QQQ, QQQ Puts or SQQQ.
Preferred Long ETF’s: QQQ and TQQQ
RUT: Downside Market Short the IWM, IWM Puts or TZA.
Preferred Long ETF’s: IWM and TNA
The How to Make Money Trading Stock Show—Free Webinar every Friday at 11:00 a.m. PDT. This weekly live and recorded webinar helped traders find great stocks and ETF’s to trade with excellent timing and helped them stay out of the market during times of weakness.
How to Make Money Trading Stocks on Friday, Sept 30th
Register now for the next live webinar at the link below:
Register Here: https://attendee.gotowebinar.com/register/2727166400059649
11:00 a.m. PDT
To get notifications of the newly recorded and posted How to Make Money Trading Stocks every week subscribe at the Market Tech Talk Channel: https://www.youtube.com/c/MarketTechTalk
– The Active Trend Trader Referral Affiliate Program is ready. For more information or to become an Affiliate please register here: https://activetrendtrading.com/affiliates-sign-up-and-login/
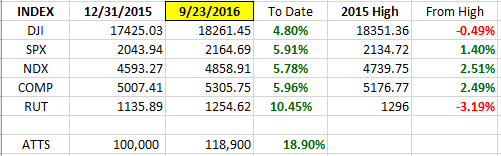
Index Returns YTD 2016
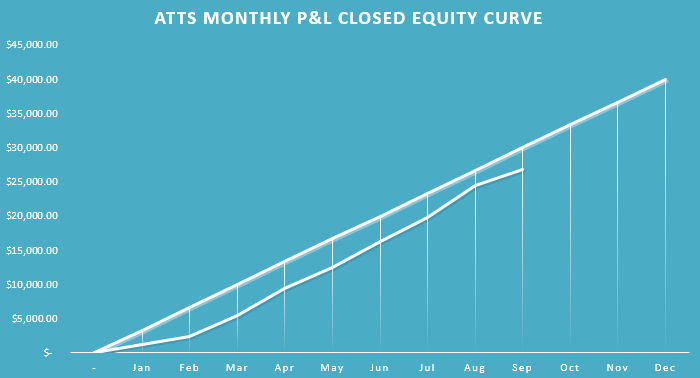
ATTS Returns for 2016 through Sept 23, 2016
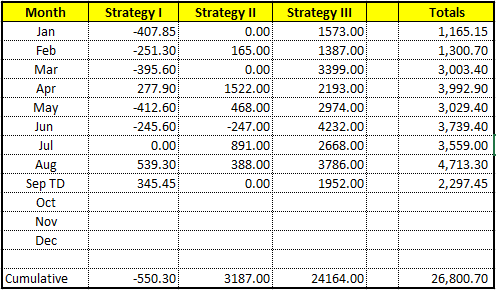
Percent invested initial $100K account: Strategies I & II invested at 3.5%; Strategy III invested at 15%.
Current Strategy Performance YTD (Closed Trades)
Strategy I: Down -550.3 or -0.7%
Strategy II: Up $3187.00 or +3.18%
Strategy III: Up $24,164
Cumulative YTD: 26.8%
Active Trend Trading’s Yearly Objectives:
– Yearly Return of 40%
– 60% Winning Trades
– Early Warning Alert Target Yearly Return = 15% or better
For a complete view of specific trades closed visit the website at: https://activetrendtrading.com/current-positions/
Updated first full week of each month. The next update first week in October.
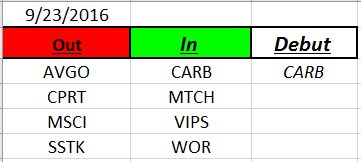
Outs & Ins: CARB makes it’s IBD 50 debut this weekend. This low price and low volume stock is pushing up against long term resistance at 15.43. There are better choices for long side trades.
I’ll be watching ACIA, PLNT, MOMO, VIPS, COR, LGIH, & FIVE this week. Several of these need to pullback to a better launch point but look promising if the market stays in gear to the upside.
Share Your Success: Many of you have sent me notes regarding the success you are having with the Active Trend Trading System. Please send your stories to me at dww@activetrendtrading.com or leave a post on the website. Thanks.