
Good Day Traders,
Overview & Highlights: This weekend’s issue has Part 2 of Mike’s observation about Trend Trading systems using various moving averages. This is very similar to how we use the 8 period and 20 period moving averages with the Active Trend Trading System.
Webinars: At Active Trend Trading we offer two webinars per week to provide training plus trade and market updates. See the schedule below for the next webinars.
How to Make Money Trading Stocks on Friday, Aug 5th—Friday!
Register Here: https://attendee.gotowebinar.com/register/4700411485556015107
11:00 a.m. PDT
Next Training Webinar: Aug 3rd
For Premium Members our Wednesday evening training is developing some fantastic traders!
Topic: Finding Top Notch Stocks
Mike’s Macro Market Musings: Trend Trading Part 2
I have written before about true trend following strategies and methods and have even presented examples of one or two sample strategies for your consideration which should only be considered as suggestions for back testing and/or forward testing since they were based on empirical observations and not rigorously tested. Most trend following strategies involve price action breaking out (or down) above or below prior price highs/lows or above/below a certain moving average. Other strategies involve moving average crossovers utilizing 2 or 3 different moving averages. One example of a trend following strategy is that employed by Dennis in Active Trend Trading, consisting of going long when price action closes above the 8 day ema and staying long until price closes below the same 8 day ema.
True trend following strategies that are properly structured and extensively back tested will be profitable over long periods of time. Many hedge funds utilize different types of trend following strategies and large fortunes have been made (albeit over long periods of time) by doing so. As an example, one might want to learn a little about Ed Seykota, a well known figure in the world of trend following and one of the first to use computers to back test different trend following strategies. Ed Seykota turned $5,000 into $15,000,000 over a 12 year time period in his model account–an actual client account. It is believed he accomplished this by utilizing a moving average crossover strategy across a large basket of varying commodity futures (he has never divulged what combination of moving averages he utilized, though there is speculation that it involved a crossover of the 11 and 56 day ema’s).
For most people, true trend following strategies are difficult to adhere to because of their drawbacks, which can include low winning percentages and long periods of whipsaw losses that can become quite discouraging. Over time, trend following strategies are profitable overall due to the occasional big winner which more than makes up for the many small whipsaw losses. Missing out on these few occasional big winners can turn a potentially profitable strategy into a losing one.
Perry Kaufman in his 2013 book Trading Systems and Methods offered several reasons why trend following systems work and offers some examples of profitable trend following strategies. As with anything, trend following strategies can be simple or complex. An example of a simple strategy is to use price as it crosses a moving average, as mentioned above with the 8 day ema. With a long-term MA, these rules guarantee you will be on the right side of all major trends, holding stocks in extended bull markets and cash in deep bear markets. The chart below shows the results of all trades for a 40-day MA strategy trading the S&P 500 since 1988. Overall, the strategy gave 304 buy signals and just 27.6% of trades were winners. Despite the low win rate, the system was profitable because it caught all of the big trends. Large spikes show there were some large wins but most trades were small losses. Those big wins are important. Missing the 4 best trades would have resulted in a loss instead of a gain over the 28-year test period.
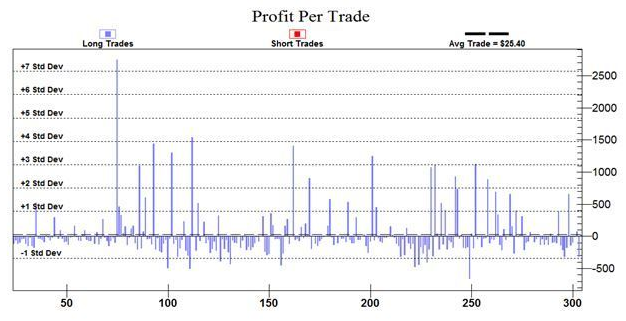
These results are typical of trend following systems. Kaufman found the percentage of winning trades is always low, sometimes less than 20%. Many small losses are offset by a few large winners. Winners are held much longer than losing trades and it is common to have extended periods of time with losses.
Rather than focusing on win rates for trend following systems, Kaufman advises looking at the profit factor (PF) of the trading strategy. The PF is the ratio of gross profits divided by the gross losses for the entire test period. A PF greater than 1 indicates the system is profitable in the long run. A good strategy often has a PF greater than 2, indicating that it generates a profit of more than $2 for every $1 it loses.
Our simple 40-day MA strategy has a PF of 1.28. The PF allows us to quickly evaluate the impact of changing system parameters. For example, a 20-day MA reduces the PF to 1.18. The table below shows how the PF changes as the length of the MA changes. Commissions of $5 per trade are deducted to make the results a little more realistic.
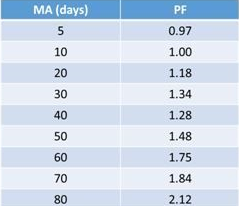
Note that, in general, as the length of the MA increases the PF improves. There are fewer trades as the MA length increases and fewer whipsaw losses and potentially larger winning trades.
Kaufman also looked at using multiple MAs. For example, a two-MA strategy buys when the shorter MA crosses above the longer MA. This strategy could use a 40-day MA and an 80-day MA, buying when the 40-day MA moves above the 80-day MA. Systems with two MAs tend to deliver performance that is between the two MAs. For example, he showed a system using 40-day and 80-day MAs did better than a 40-day MA system but worse than an 80-day MA. His work leads to the conclusion that two MAs aren’t a significant improvement but systems with three MAs are perhaps worth exploring.
As an example, we could use a 20-day, 40-day and 80-day MA. Kaufman found adding a third MA reduced the number of trades and generally improves the system performance. Rules for this strategy are still relatively simple:
- Buy when the shortest MA is above the other two MAs. In this case, buy when MA(20) is greater than MA(40) and MA(80).
- Sell when the shortest MA falls below either MA or when MA(20) is less than MA(40) or MA(80).
This results in a PF of 1.91, less than the simple 80-day MA strategy but the win rate improves to 48.4%. Some traders like high win rates and might be willing to sacrifice some profits to be right more often. Other traders would rather make money than be right and are willing to accept low win rates.
The best system depends on your answer to the question “would you rather be right or make money?” If being right is important, consider using three MAs. If making money is more important, a simple MA system is probably best. Either way, you are likely to enjoy profits in the long run.
Research consistently confirms trend-following systems are almost always profitable over long periods of time. However, they are difficult to follow for the long run. The low win rate is one problem. Another problem is that the systems will underperform a buy and hold strategy for years at a time. While the system is underperforming, many traders abandon it. Then they miss out on the gains that eventually follow.
After a great deal of testing, the conclusion is obvious – there is no perfect trend following strategy. That doesn’t mean there isn’t a useful trend following strategy. One way to use this tool is an input to your investing. If the trend is up, buy aggressive stocks. When the trend is down, wait to invest new money or buy more conservative stocks. Perhaps most importantly, wait for up trends to end before moving to cash. If you sell out of positions too early you will miss out on the big money. Sitting tight and letting gains build could be the best way to grow wealth and it is certainly among the simplest ways to improve your investment results.
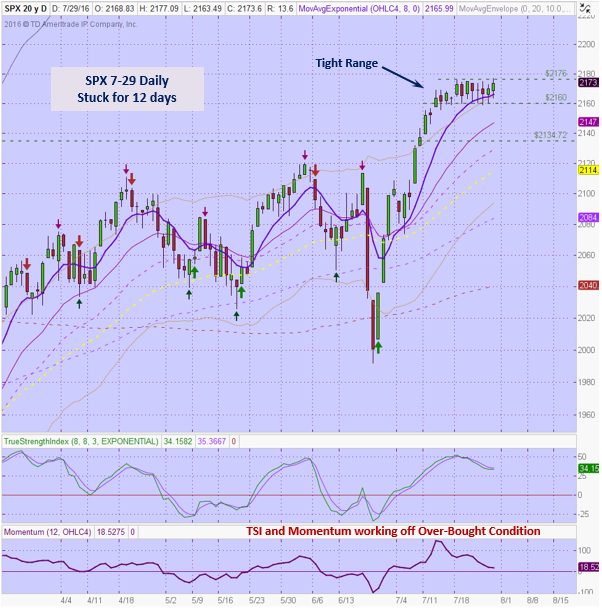
General Market Observation: What next? Normally the months of August and September are slow and often weak months. This may not be the case for 2016. The Fed met last week, GDP took a dip and there was little reaction by the three Tracking Indexes. The SPX has been stuck in a tight trading range for the last 12 days with support at 2160 and resistance at the 2176 level. While prices have been moving sideways the overbought condition on the oscillators has eased. One can make a case for a breakout above 2176 and a move higher up towards 2250. If this is the next thrust up, then the 8 day EMA catching up with price action may be the only clue we get to get onboard. Based on Fibonacci Extensions price should run into resistance between the 2190 and 2200 levels which corresponds to an extension of 161.8%. If prices do push higher yet the TSI and Momentum lag this will show negative divergence which could potentially lead to a more significant pull back.
Buying a half position in the leveraged SPX ETF, UPRO at the 8 day EMA would be a good entry with a stop just below the 72.50 level. I would place my targets at 75.60 and 80.00 to the upside with a trade like this.
I highlighted on the Friday that the NDX took out last year’s high intraday and fell back gently. Last week was also the fifth week in a row the NDX moved up strongly. On the last few big bounces this Index did go up strongly for 6 weeks and then weakened. At some point a pause will appear but it wasn’t last week. The Russell also logged 5 weeks of gains with last week being up but at a slower pace. We know that the Fed holding off on an interest rate hike is good for the Small Cap Index. Price action on the RUT is at a strong resistance zone beginning at the 1225 level. We can use the 8 day EMA as a spring board for potential upside trades with either of these two Indexes. If traders go into either TQQQ or TNA a half position would be appropriate with profit targets at around 5% – 10%.
SPX: Downside Market Short the SPY, SPY Puts or SPXU.
Preferred Long ETF’s: SPY, UPRO and SPXL
NDX: Downside Market Short the QQQ, QQQ Puts or SQQQ.
Preferred Long ETF’s: QQQ and TQQQ
RUT: Downside Market Short the IWM, IWM Puts or TZA.
Preferred Long ETF’s: IWM and TNA
The How to Make Money Trading Stock Show—Free Webinar every Friday at 11:00 a.m. PDT. This weekly live and recorded webinar helped traders find great stocks and ETF’s to trade with excellent timing and helped them stay out of the market during times of weakness.
How to Make Money Trading Stocks on Friday, Aug 5th—Friday!
Register Here: https://attendee.gotowebinar.com/register/4700411485556015107
11:00 a.m. PDT
To get notifications of the newly recorded and posted How to Make Money Trading Stocks every week subscribe at the Market Tech Talk Channel: https://www.youtube.com/c/MarketTechTalk
– The Active Trend Trader Referral Affiliate Program is ready. For more information or to become an Affiliate please register here: https://activetrendtrading.com/affiliates-sign-up-and-login/
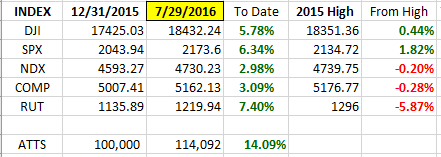
Index Returns YTD 2016
ATTS Returns for 2016 through July 22, 2016
Percent invested initial $100K account: Strategies I & II invested at 8.6%; Strategy III invested at 25.98%.
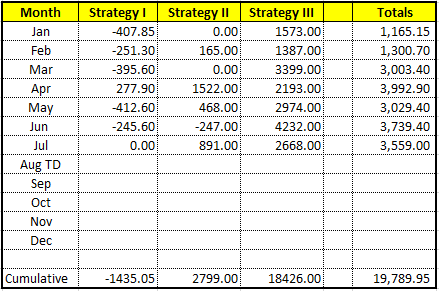
Current Strategy Performance YTD (Closed Trades)
Strategy I: Down -1435.05 or -2.05%
Strategy II: Up $2391.00 or +27.99%
Strategy III: Up $17252 or +67.9%
Cumulative YTD: 19.78%
Active Trend Trading’s Yearly Objectives:
– Yearly Return of 40%
– 60% Winning Trades
– Early Warning Alert Target Yearly Return = 15% or better
For a complete view of specific trades closed visit the website at: https://activetrendtrading.com/current-positions/
Updated first full week of each month. The next update August.
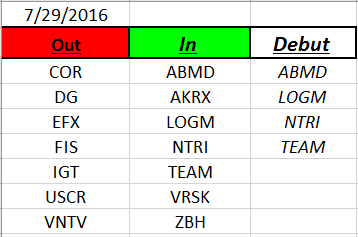
Outs & Ins: ABMD, LOGM, NTRI and TEAM make their debut on the IBD 50 this weekend. ABMD just reported earnings and is bouncing off the 8/20 day EMAs. LOGM gapped clear of all resistance at 82.50 on earnings. Huge buying volume accompanied this breakout move. Watch for a retest around the 82.50 level. NTRI also pushed up into past resistance after earnings breaking from a cup & handle formation. TEAM is putting in an excellent pre-earning’s run and can wait until after earnings before considering for a long position. This is fairly rare but all the stocks except TEAM appear to be good upside candidates when proper entry points appear.
Watch BSFT which is currently pulling back. WBMD, IPHI and AVGO may provide pre-earning opportunities going into August.
Share Your Success: Many of you have sent me notes regarding the success you are having with the Active Trend Trading System. Please send your stories to me at dww@activetrendtrading.com or leave a post on the website. Thanks.