
Good Day Traders,
Overview & Highlights: Mike Trager has put together another dynamite commentary on forces lurking and threatening the current market. Great Read! Additionally earnings season swings in to full gear this week with many companies reporting.
I will be away Sunday and Monday of this week visiting friends who are out of mobile phone coverage. I will have no internet access and will check back in Monday evening. Lastly with the great trades in TSLA for Strategy III this week the long LEAPS positions have been paid for, so now we have 40 weeks to continue collecting premium on this position. That will be about $350 per week at current averages! Strategy III has been a great way to keep accounts growing during the current market environment!
Webinars: At Active Trend Trading we offer two webinars per week to provide training plus trade and market updates. See the schedule below for the next webinars.
How to Make Money Trading Stocks on Saturday, April 23rd
Register Here: https://attendee.gotowebinar.com/register/740504962611574275
Note this session will be at: 10:00 a.m. PDT
Next Training Webinar: April 20
For Premium Members our Wednesday evening training is developing some fantastic traders!
Mid-Week Market Sanity Check Topic: How to Protect your Trade with Conditional Orders
Mike’s Macro Market Musings: The R Word Revisited – “Trumping” the Fed
It seems to me that during the course of his campaign for nomination as the Republican candidate for president that Donald Trump has spent a good bit of time searching for a large enough foot to insert into his mouth. Some in the mainstream media claim evidence for this in an interview approximately a week ago with the Washington Post in which Trump states that the U.S. is headed for a massive economic recession in the not too distant future and that this is not a good time to be investing in stocks. The media, our government, and our esteemed Federal Reserve Board would like us to believe that everything is actually going really well and that there is no sign of recession anywhere on the horizon. Despite what one might think about Mr. Trump and some of his claims, nobody is wrong (or right) all of the time; even a broken analog clock is right twice a day. Is he really wrong in his assessment of the current economic environment and the investing climate? Maybe, maybe not. Let’s examine some of the data and see what conclusions might logically be drawn.
Some of the following information is drawn from prior columns, and some is relatively new and current. First of all, let’s review the technical definition of the word “recession” as it applies to the U.S. economy (“recession” can also be used to describe some men’s hairlines, but we will confine our discussion to economic references). An economic recession is defined as two consecutive quarters of negative U.S. GDP growth. This is by necessity a very lagging denotation since, by the time two consecutive quarters of negative growth have occurred, much of the damage has already been done and, historically, by the time a recession is recognized and officially announced, it is often closer to ending than to beginning. So wouldn’t it behoove us to recognize a recession, or at least recessionary conditions, without having to wait for a government agency to make an official announcement? I think so, and there is certainly a lot of data out there to enable us to do so. Some of the following charts will speak for themselves; some commentary will be provided where it might seem to help
The chart below shows the S&P 500 index with recessions and when the National Bureau of Economic Research dated the start of the recession.
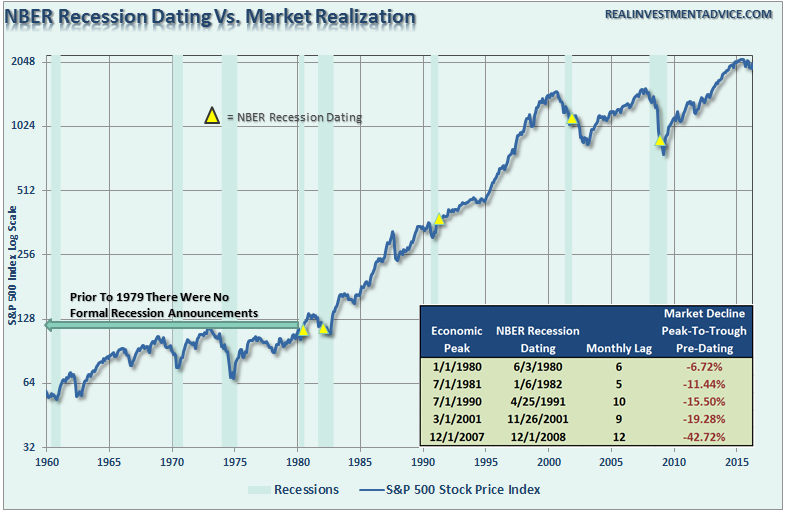
According to this data, there have been five “official” recessions since 1980. The average time lag between the preceding economic peak and the officially announced start of the recession has been around 8 months and the average decline in the S&P 500 from that same economic peak date to the official recession starting date has been approximately 19%, with a near 43% (!) decline preceding the official “start” of the most recent recession. Note that the “official” start date for the last recession of 12/1/2008 was just about 3 months before the market bottomed in March of 2009 and 12 months after the preceding economic peak, and approximately 13-14 months following the preceding peak in the S&P 500; most of the damage had already been done before the recession had even “officially” started.
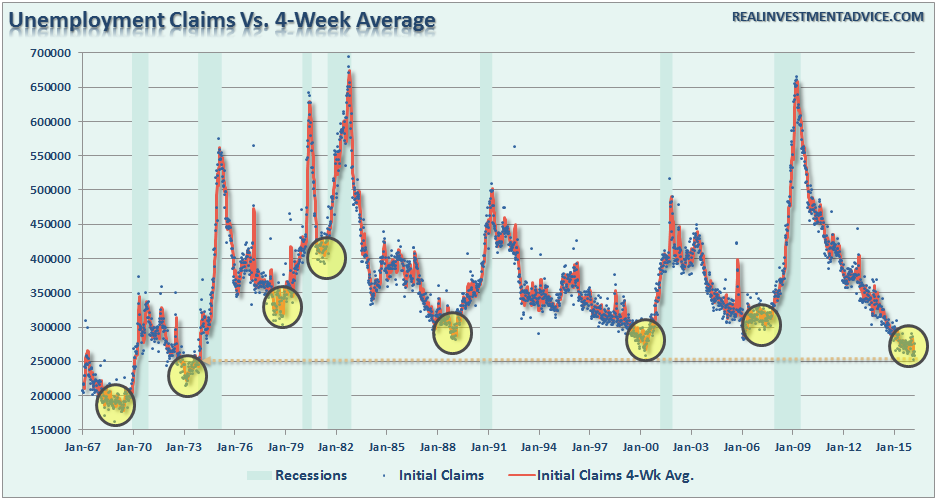
Relatively low levels of jobless claims have historically noted the peak of economic growth and warned of a pending recession. Recessions don’t begin when unemployment claims are historically high (in fact that’s usually when recessions are at their worst and then things start getting better), recessionary conditions are setting up when unemployment claims are relatively low and the media is reporting the good news.
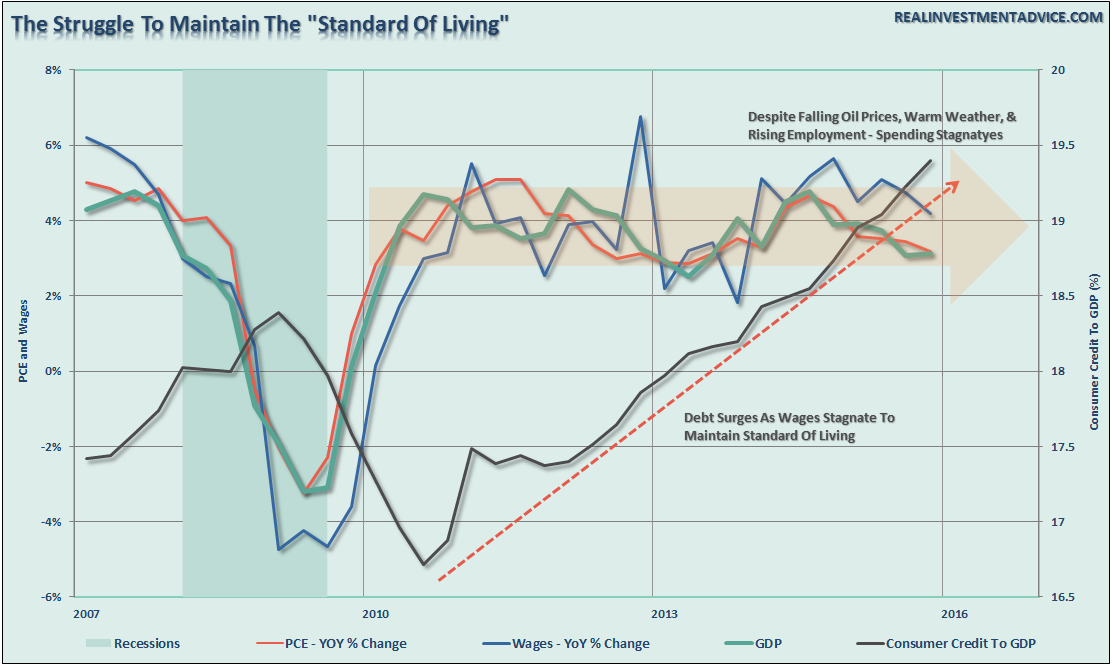
Since the financial crisis, the average American has not seen much of a recovery. Wages have remained stagnant, real employment has been subdued and the actual cost of living (when accounting for insurance, college, and taxes) has risen rather sharply. The net effect has been a struggle to maintain the current standard of living which can be seen by the surge in credit as a percentage of the economy. That is, over the past several years, the rising costs of living have surpassed the increase in income of the average American, forcing people to take on more debt (auto loans, college loans, etc.) just to maintain their standard of living. Personal spending has been stagnant despite falling energy and utility costs requiring lower expenditures for gasoline and monthly utility bills and therefore, theoretically, more cash available for other discretionary spending.
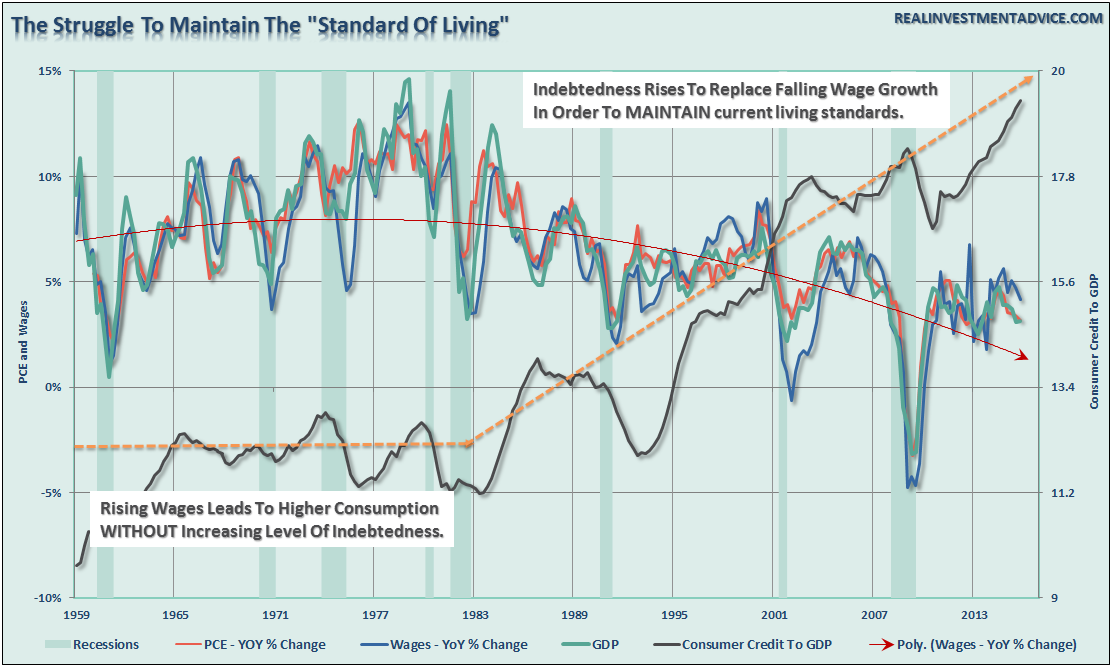
To put this into perspective, we can look back throughout history and see that substantial increases in consumer debt to GDP have occurred coincident with recessionary drags in the economy. In fact, the current ratio of consumer debt to GDP is higher than it has ever been since 1959. At some point, consumers are either unable or unwilling to take on more debt to fund their living expenses, and this chart shows that we are certainly closer to that point than at any time in the past several years. For an economy that is nearly 70% dependent on consumer spending, this does not bode well. No sign of recession? Are you sure about that?
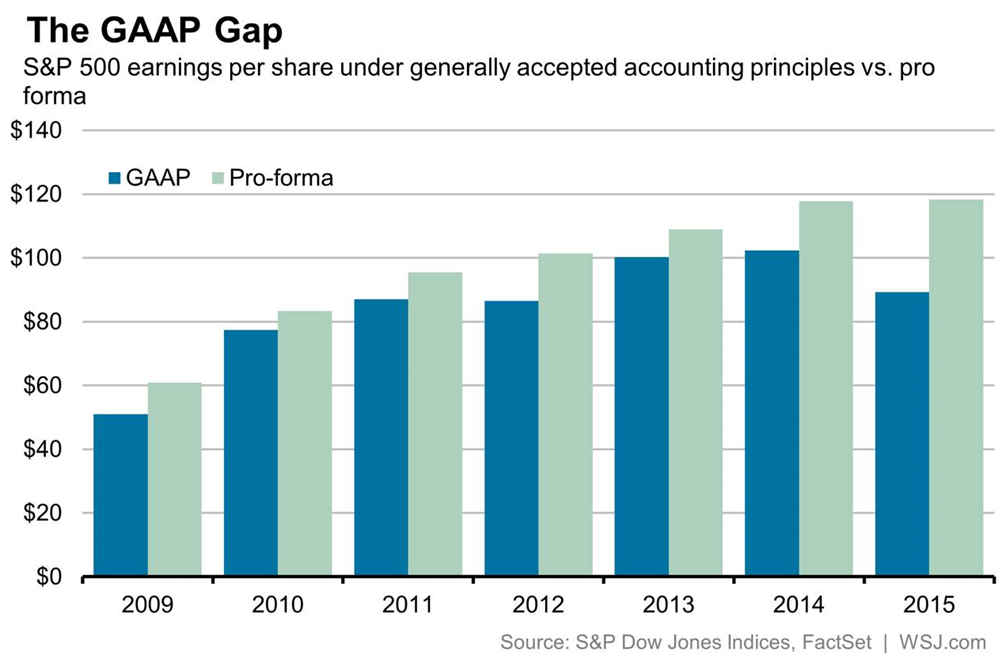
Mind the gap: now that the final results for the calendar year 2015 are known, overall S&P 500 earnings under GAAP came to $787 billion last year, S&P Dow Jones Indices estimates. That is $256 billion less than the pro forma estimate of $1.04 trillion, or a ratio of GAAP earnings to pro forma earnings of approximately .75. This figure of .75 is the current GAAP gap. Outside of 2008, the only other times the GAAP gap was as wide as last year was in 2001 and 2002. That was back when companies wrote off billions of dollars’ worth of dot-com bubble-era investments. We should all know by now what happened in the equity markets in 2001-2002 and 2008-2009 when the GAAP gap was as wide as it is currently.

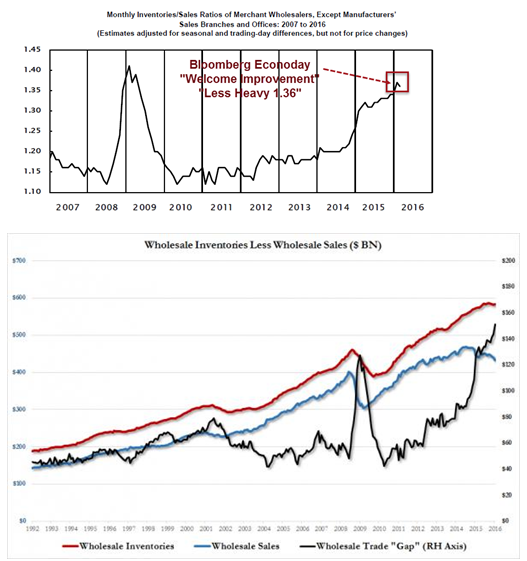
Inventory to sales ratios are currently at levels only marginally lower than seen near the trough of the last two recessions, seemingly indicating that inventories are piling up as consumers slow their purchases and wholesale sales decline. Wholesale inventories have been rising only marginally but have still been well ahead of wholesale sales which have been falling.
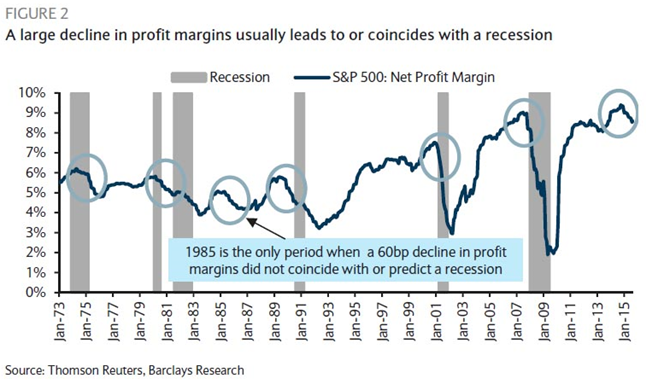
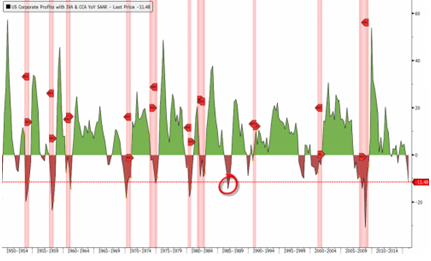
Declining U.S. profit margins and declining overall whole economic profits and sales are not usually associated with periods of economic expansion:
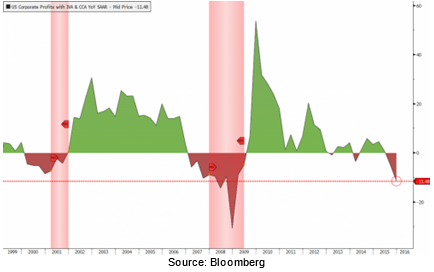
Net corporate profits overall are also giving a very clear warning signal on the US economy and stock market as well. On a year-over-year basis, the current decline is now steeper than the readings we saw entering the 2001 and 2008 recessions.
 If we look at the data going back to 1950, there was only one instance in 1986 (circled in red) where profits have declined this far year-over-year without the US economy entering a recession.
While being optimistic about the economy and the markets certainly is far more entertaining than doom and gloom, it is the honest assessment of the data and the underlying trends that is useful in protecting one’s wealth longer term.
Is there a recession currently? Maybe, maybe not
Will there be a recession in the not so distant future? Absolutely.
While there is a plethora of current real time data points at levels associated with prior recessionary periods, Trump’s call for a “massive recession” may very well turn out not to be true. And Ms. Yellen confidently states that our economy is doing well and there is no sign of recession either now or in the near future while also simultaneously refusing to raise interest rates, an action the Federal Reserve usually takes when economies mend as they emerge from recessionary conditions. As a side note, she has also previously honestly acknowledged that she did not see 2008 coming when she was vice chairperson of the Fed and that she did not see the housing bubble in real time as it developed and began to break down.
However, whether it is a mild, or “massive,” recession will make little difference as the net destruction to personal wealth will be just as disastrous. That is the nature of recessions on the financial markets. While Trump’s call of a “massive recession” may seem far-fetched based on today’s economic data points, no one was calling for a recession in early 2000 or 2007 either. By the time the data is adjusted and reported, and the eventual recession is “officially” revealed, it won’t matter as the damage will have already been done.
General Market Observation: While Mike’s article provides some great food for thought about the underpinnings of both the U.S. and Global markets, it is not yet actionable because the Indexes continue to push higher. The Russell seems to be gaining some strength and the S&P and NDX have pushed up to solid resistance. For next week several items will potentially be reasons for the market to move either higher or lower or go nowhere. First, Monday will mark the finish of the investment period for 401ks and IRA’s for 2015. Secondly, it is the week before the Fed meeting and often the market vacillates in a tight range the week prior to the Fed. Lastly what will the outcome of the Oil summit this weekend? Each of these could provide a catalyst to drive the 3 Tracking Indexes higher or into pullback from current resistance.
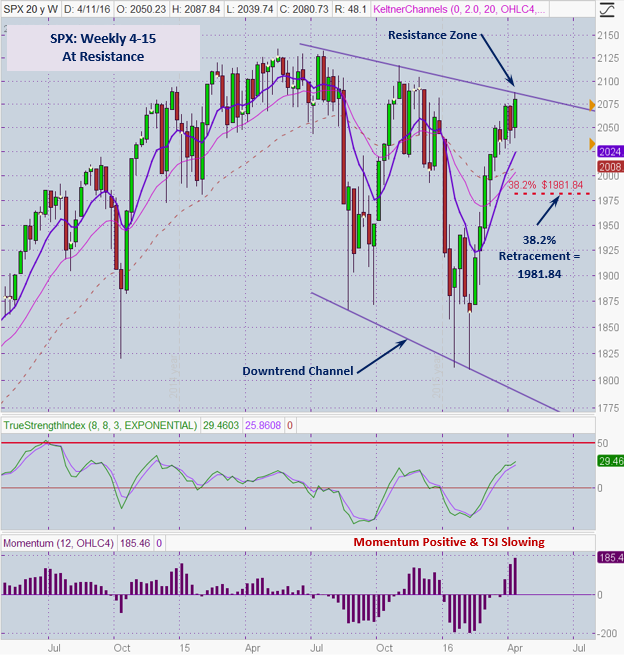
The SPX went into stall mode on Thursday and Friday on a daily chart. Each day made no real upward progress and finished the day with a Doji and Spinning Top candle. These are both signs of indecision and more predictive when the happen at resistance. Note how as price made new highs both TSI and Momentum were lagging. This action has formed negative divergence on a daily basis.
On the weekly chart below it is clear that price action remains contained by the down trend channel. I’m looking for symmetry with the last time prices pushed up to the top of the channel in November and December. As depicted on the chart prices didn’t immediately fall but held near the top of the channel for nine weeks before giving way to the accelerated plunge in late December. If the index repeats a similar pattern then price could move in a fairly tight range for several weeks. June will be here in about 6-7 weeks and could potentially follow a similar pattern to the market in early 2008. At this point I’m not ready to go big to the downside but will be watching for weakness near current highs for short term downward trades.
The NDX is showing a similar personality to the SPX. The RUT has pushed up to resistance and also flashed two Spinning Top candles to close of last week. At this point on each of the Indexes it’s not the time to go long or short until additional clues appear.
SPX: Downside Market Short the SPY, SPY Puts or SPXU.
Preferred Long ETF’s: SPY, UPRO and SPXL
NDX: Downside Market Short the QQQ, QQQ Puts or SQQQ.
Preferred Long ETF’s: QQQ and TQQQ
RUT: Downside Market Short the IWM, IWM Puts or TZA.
Preferred Long ETF’s: IWM and TNA
The How to Make Money Trading Stock Show—Free Webinar every Friday at 11:30 a.m. PDT. I’m looking for the best time to offer this webinar. I want to try closer to the close on Friday to see how that works out for potential trades going into the close. This weekly live and recorded webinar helped traders find great stocks and ETF’s to trade with excellent timing and helped them stay out of the market during times of weakness.
How to Make Money Trading Stocks on Saturday, April 23rd
Register Here: https://attendee.gotowebinar.com/register/740504962611574275
Note this session will be at: 10:00 a.m. PDT
To get notifications of the newly recorded and posted How to Make Money Trading Stocks every week subscribe at the Market Tech Talk Channel: https://www.youtube.com/channel/UCLK-GdCSCGTo5IN2hvuDP0w
The Active Trend Trader Referral Affiliate Program is ready. For more information or to become an Affiliate please register here: https://activetrendtrading.com/affiliates-sign-up-and-login/
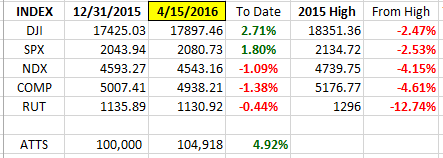
Index Returns YTD 2016
I’ve added a column to the Index YTD performance chart. The column on the far right shows the depth of the current correction with respect to the highs of the top from 2015. Note both DJI & SPX are now in positive territory for 2016.
ATTS Returns for 2016 through April 15, 2016
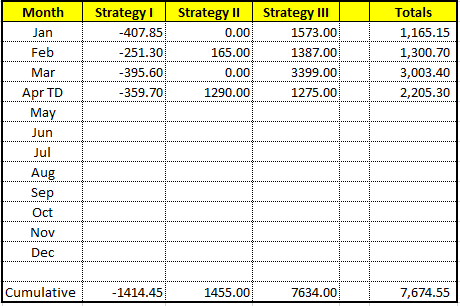
Percent invested $100K account: Strategies I & II invested at 0%; Strategy III invested at 20%.
Current Strategy Performance YTD (Closed Trades)
Strategy I: Down -1414.45 or -1.41%
Strategy II: Up $1455 or 14.55%
Strategy III: Up $7634 or +38.1%
Cumulative YTD: 7.67%
Active Trend Trading’s Yearly Objectives:
– Yearly Return of 40%
– 60% Winning Trades
– Early Warning Alert Target Yearly Return = 15% or better
For a complete view of specific trades closed visit the website at: https://activetrendtrading.com/current-positions/
Updated first full week of each month.
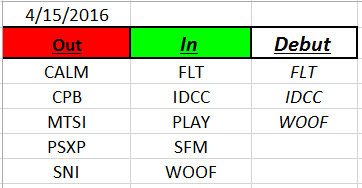
Outs & Ins: FLT, IDCC & WOOF make their debut on the this weekend’s IBD 50. FLT and IDCC have been on the list in past years. It would have been great if these entrants would have been added about 4 weeks ago before they started their moves back up to resistance.
For breakout traders several of the IBD 50 are approaching breakout levels. Additionally the lion share of the List is sporting strong fundamentals. The majority of the 50 will be reporting earnings over the next few weeks so this may provide some pre-earnings trading opportunities. TREE, SIX & ELS may have pre-earnings potential.
Share Your Success: Many of you have sent me notes regarding the success you are having with the Active Trend Trading System. Please send your stories to me at dww@activetrendtrading.com or leave a post on the website. Thanks.