
Good Day Traders,
Overview & Highlights: To provide more actionable information I have started putting out the “On the Radar” report on Sunday evenings. This report will not have a lot of analysis but will focus on specific setups that may show up the following week. Let me know how helpful this streamlined report to your planning.
Mike’s Macro Market Musings provides an excellent analysis of where the current market conditions with a bit of Warren Buffet wisdom.
Upcoming Webinars: At Active Trend Trading we offer two webinars per week to provide training plus trade and market updates. See the schedule below for the next webinars.
The How to Make Money Trading Stock Show—Free Webinar every Friday at 11:00 a.m. PDT. This weekly live and recorded webinar helped traders find great stocks and ETF’s to trade with excellent timing and helped them stay out of the market during times of weakness.
How to Make Money Trading Stocks on Friday, Jan 27th
Register now for the next live webinar at the link below:
Register Here: https://attendee.gotowebinar.com/register/8107225178346987265
Time 11:00 a.m. PDT
Next Training Webinar: Jan 25th
For Premium Members, our Wednesday evening training is developing some fantastic traders
Topic: Seasonality tied to the Leveraged ETFs
** Friday’s “Final Hour”: Jan 27th **
Time 12:00 p.m. PDT
For Premium Members, provides trades and set ups during the final hour of weekly trading
Mike’s Macro Market Musings: Warren Buffett and an Equities History Lesson I first learned of, and started reading about, Warren Buffett in the late 1980’s and early 1990’s as I embarked on a course of self-education in investing. At the time, he was well known in the financial world but not so much to the general public. In fact, I briefly considered buying some shares of Berkshire Hathaway in the early 1990’s as I became aware of his track record. However, at a then unheard of price of around $10,000 per share, I did not do so (after all, who in their right mind would pay $10,000 for one share of stock?). Imagine my chagrin when I occasionally glance at a chart for BRK/A, the price of which recently peaked at $250,786 – in hindsight, $10,000 per share seems like a bargain basement price. Needless to say, he doesn’t advocate splitting the shares of the stock in his company.
During the course of his career he has at times been considered irrelevant or as “having lost his touch” since he eschewed the fashionable go-go stocks of the early 1970’s (the so called “Nifty Fifty”) and the high fliers of the dot com era. The poor performance of his recent investments in blue chip technology stocks such as IBM and Apple would seem to indicate that his reputation is going through another one of these periods. In my mind, however, the one thing that cannot be questioned about him is his view on equity valuations and what predictive value they can have in terms of forecasting longer term expectations of returns in the equity markets. He has always been a student of the markets and is now old enough to have lived through and learned the lessons of what we now consider market history – actually, he now is part of that history. And although he is the beneficiary of a long running PR campaign that portrays him as a type of benign kindly grandfather of the financial world (something he most certainly is not), there certainly is value in some of the lessons one can learn from him. Consider the following excerpt from his annual letter to Berkshire shareholders in 1992: “However, it is clear that stocks cannot forever over perform their underlying businesses, as they have so dramatically done for some time, and that fact makes us quite confident of our forecast that the rewards from investing in stocks over the next decade will be significantly smaller than they were in the last.” He was right, as the following will illustrate:
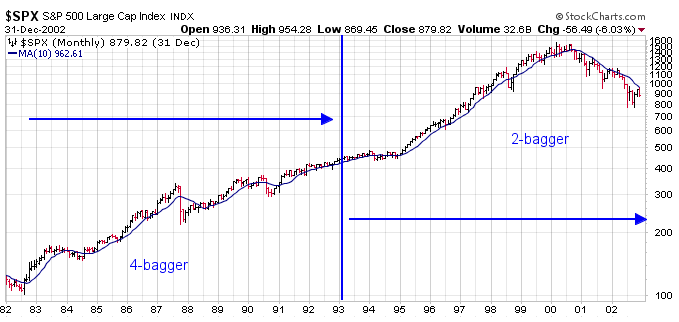
In Buffett’s example, he’s referring to the wonderful returns equity investors experienced from 1982-1992. During that span investors roughly quadrupled their money. Over the coming decade, they merely doubled their money so Buffett was right that the decade beginning in 1993 would fall far short of the return of the prior decade even if they were still very good.
Buffett made another prescient forecast in November 1999 when he wrote:
“Today, staring fixedly back at the road they just traveled, most investors have rosy expectations. A Paine Webber and Gallup Organization survey released in July shows that the least experienced investors–those who have invested for less than five years–expect annual returns over the next ten years of 22.6%. Even those who have invested for more than 20 years are expecting 12.9%. Now, I’d like to argue that we can’t come even remotely close to that 12.9%… you need to remember that future returns are always affected by current valuations and give some thought to what you’re getting for your money in the stock market right now.”
You probably already know that stock market returns from 1999 to 2009 were not very kind to investors.

And Buffett tells us how he was so confident that this would be the case. He examined the conditions that allowed for returns to be so wonderful from 1982-1999 but were no longer present in 1999: wonderful valuations. Stocks were so cheap in 1982 that the coming decade was virtually guaranteed to be better than the decade that preceded it. (1972-1982 was another decade that was not fun for investors.) Then in 1999 valuations were so expensive that there was almost no possibility of decent returns going forward.
So, let’s take a look at Buffett’s favorite valuation yardstick which he refers to on both of those prior writings. It tracks the total value of the stock market in relation to Gross National Product, or Gross Domestic Product (GDP).

From the chart, it’s plain to see that valuations were extremely attractive back in the early 1980’s. This is why stocks performed so well over the next 20 years. However, I find it absolutely fascinating that stock market valuations today are essentially equivalent to valuations in November 1999 when he wrote that latter passage. Yeah, go back and read that last line again. It’s a doozy and it’s absolutely fact.
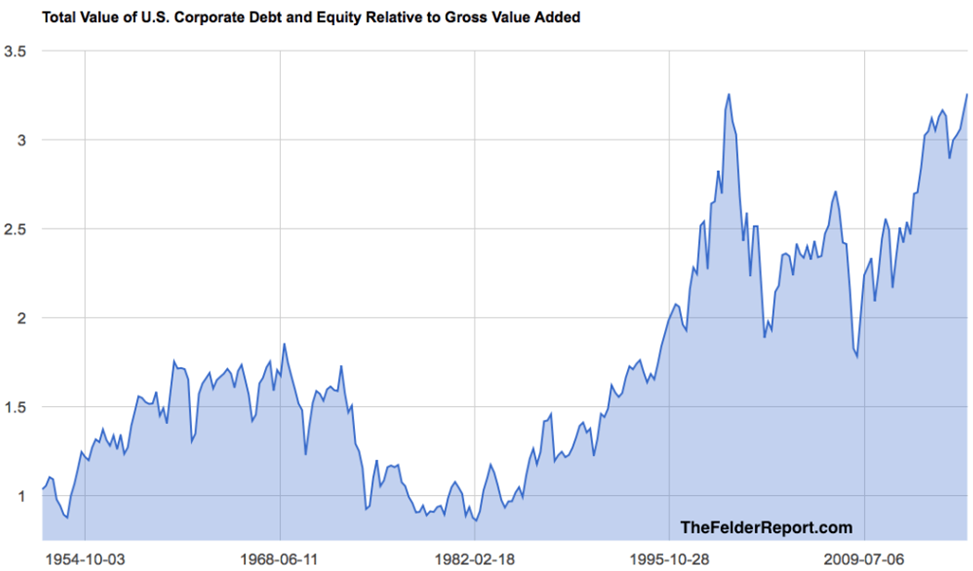
There are many different metrics for determining equity valuations. One of the most popular and well known is the price/earnings (PE) ratio. Another that is lesser known but likely more comprehensive and accurate is the enterprise value (EV) to sales ratio, a metric commonly used by private equity firms to determine valuations to be applied for corporate buyouts and mergers. It should come as no surprise that the current EV/sales ratio for the median S&P 500 stock is currently, at 2.7, the highest it has ever been in the history of the U.S. equity markets. EVER. The following chart, while not specific nor limited to the S&P 500, just about says it all in terms of current equity market valuations. It shows the value of nonfinancial corporate debt and equity relative to nonfinancial gross value added (data provided by FRED), essentially a measure of, and proxy for, enterprise value-to-sales. At approximately 3.25, it is the highest it has ever been in the past 60+ years, slightly higher even than it was at the height of the dot com silliness in 2000.
While none of this speaks to what might happen in the coming days, weeks, or months, it absolutely speaks to what one might reasonably expect over the next several years. It’s easy to get carried away by the exuberance of the Trump rally since the November election and by the index returns of the past several years resulting from the low interest rate policies and money printing efforts of global central banks and extrapolate recent performance into the indefinite future. Don’t. In the long run, valuations matter. Valuations mean revert. Always have, always will, and in both directions. Since 2012, the S&P 500 has risen almost 70% while earnings are up a mere 2%. The current P/E multiple for the S&P 500 is not just above average, it is 70% above the average of over 130 years of observations. Simple reversion to the mean in the S&P 500 P/E would require an approximate 40% correction of current S&P price, and that assumes that earnings will remain at current levels during the recession that would accompany such a correction (they won’t). A retracement of that magnitude is currently unfathomable to most investors – historically, it would be considered quite average. The current and recent trend of multiple expansion in the U.S. equity markets is simply unsustainable in the long run. As Warren Buffet stated in 1992 in the above passage, “it is clear that stocks cannot forever over perform their underlying businesses, as they have so dramatically done for some time, and that fact makes us quite confident of our forecast that the rewards from investing in stocks over the next decade will be significantly smaller than they were in the last.”
At the risk of being labeled a “party pooper” (not for the first time), I issue my caveat emptor warning in terms of realistic expectations for future returns in U.S. equity markets going forward from current valuations of same. The next 8 – 12 years will look nothing like the past 8 years, a necessary perspective for anyone nearing retirement and considering the likely performance of their longer-term retirement equity investments.
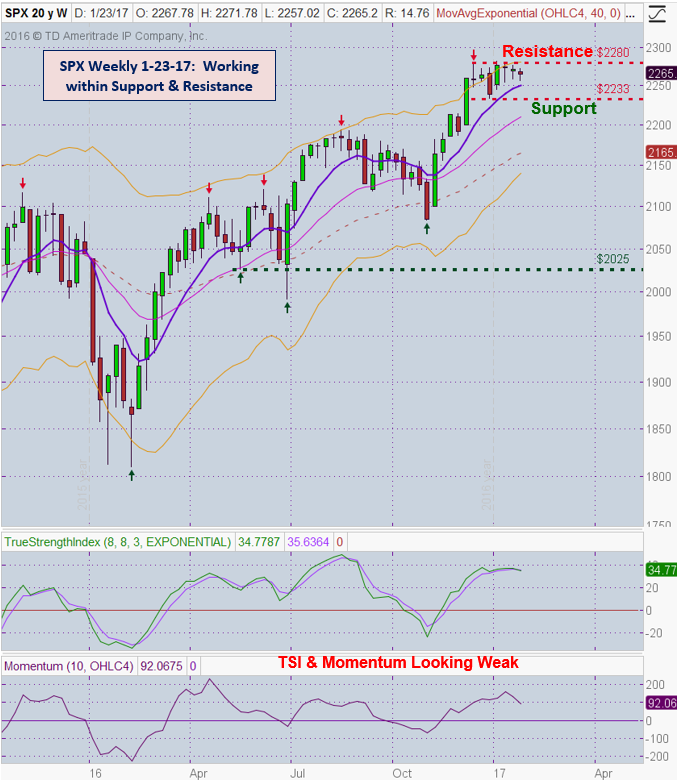
General Market Observation: With only a few more day until the first trading month of 2017 is complete it appears that the power behind the Trump Rally is running out. Each of the 3 Tracking Index is showing signs that a pullback may be in the offing. Add to this the historical weakness that usually presents itself after the inauguration of a new President and both February and March may be weak. The chart below shows a weekly chart of the SPX. Price action has been contained between resistance at the 2280 level and support at 2233 for the last 6 weeks. Both weekly TSI and Momentum are rolling over and are out of sync with the daily oscillators. Short term support is holding at 2257 so sideways price action over the next 3-4 weeks would not be surprising. There has been no significant move to the downside even though momentum continues to wane.
The NDX is starting to show a series of spinning tops at resistance. The momentum oscillators are more in sync on both the daily and weekly charts. The RUT has already moved into a short-term downtrend on the daily charts. The price weakness over the past 6 weeks is hammering over the 50 day EMA at the 1336 level. Additionally, the 8 day EMA has crossed below the 20 day EMA. Typically, the Russell will lead the other Indexes and this appears to be the case currently. Look for a pull up the 8/20 EMA combo for potential entry to the downside.
SPX: Downside Market Short the SPY, SPY Puts or SPXU.
Preferred Long ETF’s: SPY, UPRO and SPXL
NDX: Downside Market Short the QQQ, QQQ Puts or SQQQ.
Preferred Long ETF’s: QQQ and TQQQ
RUT: Downside Market Short the IWM, IWM Puts or TZA.
Preferred Long ETF’s: IWM and TNA
The How to Make Money Trading Stock Show—Free Webinar every Friday at 11:00 a.m. PDT. This weekly live and recorded webinar helped traders find great stocks and ETF’s to trade with excellent timing and helped them stay out of the market during times of weakness.
How to Make Money Trading Stocks on Friday, Jan 27th
Register now for the next live webinar at the link below:
Register Here: https://attendee.gotowebinar.com/register/8107225178346987265
Time 11:00 a.m. PDT
To get notifications of the newly recorded and posted How to Make Money Trading Stocks every week subscribe at the Market Tech Talk Channel: https://www.youtube.com/c/MarketTechTalk
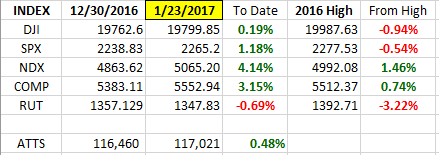
Index Returns 2017
ATTS Returns for 2016
Update at end of January 2017
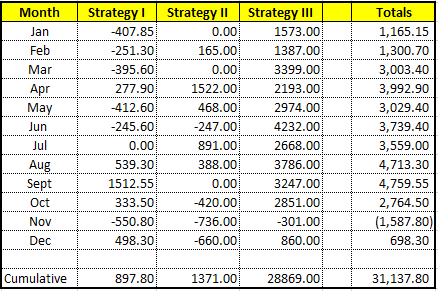
Percent invested initial $1K account: Strategies I & II invested at 0.0%; Strategy III invested at 26.6%.
Current Strategy Performance YTD (2016)
Strategy I: Up $896.15 or +1.28%
Strategy II: Up $1,371.00 or +13.7%
Strategy III: Up $28,869.00
Cumulative YTD: 31.14%
Active Trend Trading’s Yearly Objectives:
– Yearly Return of 40%
– 60% Winning Trades
– Early Warning Alert Target Yearly Return = 15% or better
For a complete view of specific trades closed visit the website at: https://activetrendtrading.com/current-positions/
Updated first full week of each month. The next update after first week in January.
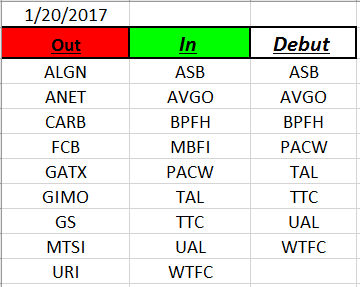
Outs & Ins: Eight stocks made their debut on the IBD 50 this week. None of these newbies made the Strong Fundamental sort. At this point they are not of interest.
Stocks that came to the top of the Fundamental Sort include: IDCC, THO, CPE, NVDA, AMAT, UBNT and ESNT. IDCC, NVDA and ESNT look the to be pulling back or consolidating.
Share Your Success: Many of you have sent me notes regarding the success you are having with the Active Trend Trading System. Please send your stories to me at dww@activetrendtrading.com or leave a post on the website. Thanks.